
Figures & data
Table 1. Detailed preparation of triple chemotherapy drug with Au nanoparticles.
Figure 1. Representative FTIR spectra of the test drugs and free Au nanoparticles.
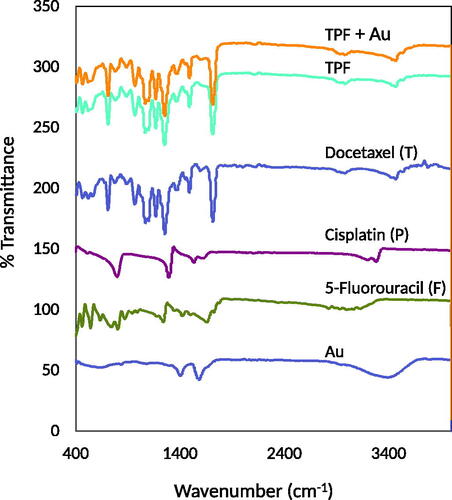
Figure 2. Representative UV–Vis spectra of free Au nanoparticles and Au nanoparticles associated with different concentrations of the test drugs at 0 h (A) and 24 h (B). Docetaxel, cisplatin, 5-fluorouracil (TPF), and Au nanoparticles prepared using different chemotherapy drug and nanoparticle compositions are shown in .
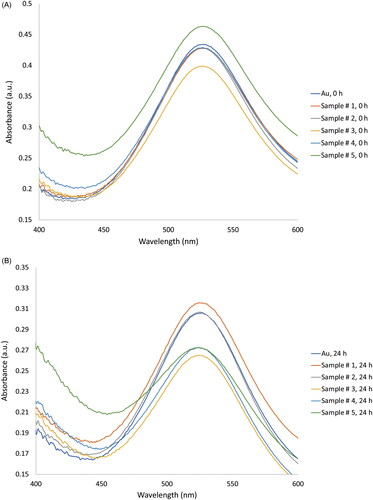
Table 2. Cytotoxicity data obtained for KB cells exposed to different concentrations of the test drugs.
Figure 4. Representative surface morphology of KB cells. Phase-contrast image of control KB cells without treatment (A1), KB1 = cells treated with docetaxel-cisplatin-fluorouracil (A2), KB2 = cells treated with the docetaxel-cisplatin-fluorouracil-Au complex (A3), and KB3 = cells treated with plain Au nanoparticles (A4). Fluorescence image of control KB cells without treatment (B1), KB1 = cells treated with docetaxel-cisplatin-fluorouracil (B2), KB2 = cells treated with the docetaxel-cisplatin-fluorouracil-Au complex (B3), and KB3 = cells treated with plain Au nanoparticles (B4). Objective: 40×.
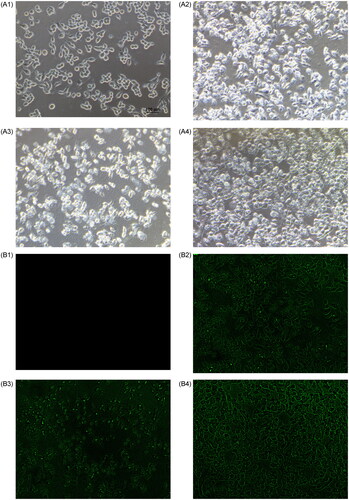
Table 3. Release rates of docetaxel, cisplatin, and 5-fluorouracil with Au nanoparticles (pH = 6.0).
Data availability statement
The authors confirm that the data supporting the findings of this study are available within the article.