
Figures & data
Figure 1. Schematic illustration of the structure of GHSO@PTX.
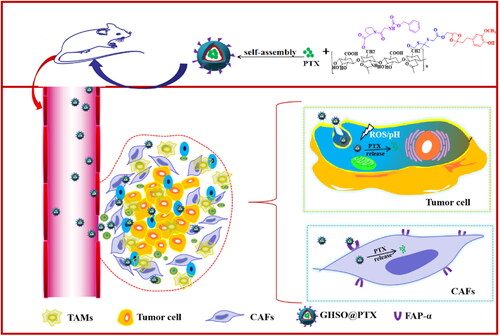
Figure 2. Design route of GHSO.
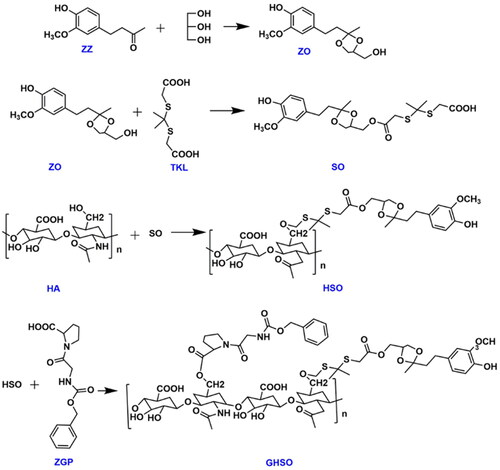
Figure 3. (A) The 1H-NMR spectra of HA, HSO and GHSO. (B) The FT-IR spectra of GHSO. (C) The TEM morphology, size, zeta of HSO@PTX micelles and GHSO@PTX micelles. (D) Curve of GHSO@PTX releasing PTX in different environments.
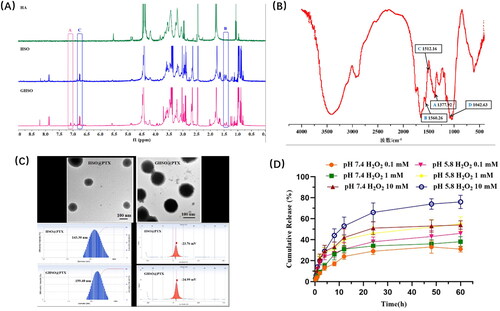
Figure 4. The cytotoxicity of different formulations 24 h (A) and 48 h (B) to SMMC-7721 cells; the cytotoxicity of different formulations 24 h (C) and 48 (D) to CAFs cells; (E) The cytotoxicity of blank micelles to SMMC-7721 and CAFs cells. (*p < .05).
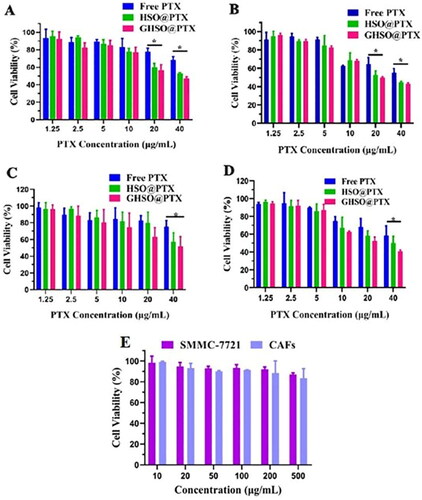
Figure 5. (A) The uptake of SMMC-7721 (A) and CAFs (B) after different administration times; The uptake of SMMC-7721 (C) and CAFs (D) after different administration concentration. (B) The penetration of GHSO@Cur (A) and HSO@Cur (B) in a 3D tumour sphere. C. The fluorescence of nude mice at different time intervals (2 h, 4 h, 8 h, 12 h and 24 h); The fluorescence intensity images of isolate organ and tumour tissues in nude mice.
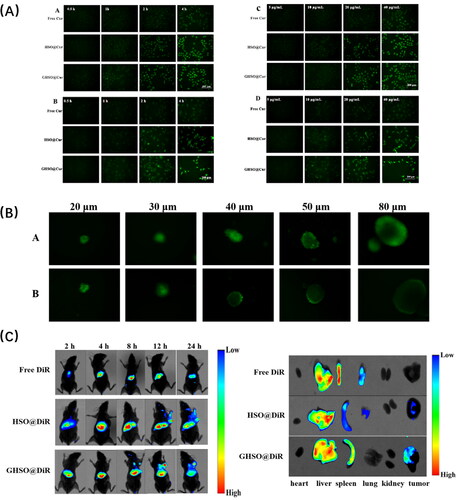
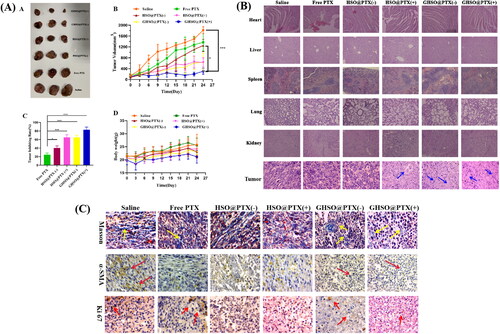
Figure 6. (A) The photographs of tumours from different groups. (B) The tumour volume changes from different groups. (C) The tumour inhibition rate from different groups. (D) The body change of tumour-bearing nude mice. B.H&E staining of major organs and tumour issue in different administration groups. (C) Masson staining, α-SMA staining and Ki 67 expression of tumour tissue. n = 3; *p < .05, **p < .01.
Data availability statement
All data generated or analysed in this study are included in this article.