
Figures & data
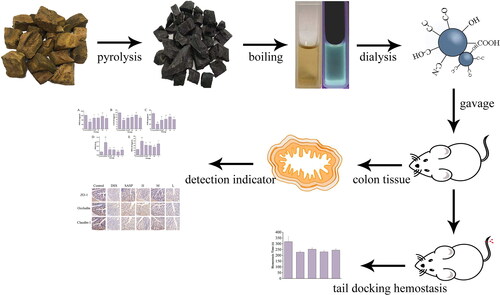
Figure 1. Preparation of Rhei radix et rhizoma-based carbon dots. The flowchart for the preparation process of carbon dots is derived from Rhei radix et rhizoma carbonisata.
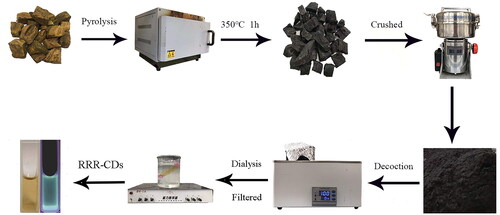
Table 1. Disease activity indexTable Footnoteb.
Figure 2. Characterization of Rhei radix et rhizoma-derived carbon dots. (A) Low-resolution transmission electron microscope image. Inset: Histogram of particle size distribution. (B) XRD pattern. (C) Ultraviolet visible specturm. (D) High-resolution transmission electron microscope image. (E) Excitation and emission fluorescence spectra. (F) Fourier transform infrared spectroscopy.
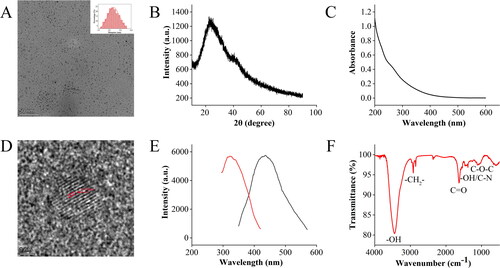
Figure 3. X-ray photoelectron spectroscopy of Rhei radix et rhizoma-carbon dots. (A) Full-scan X-ray photoelectron spectrum of Rhei radix et rhizoma carbonisata-derived carbon dots. High-resolution measurement spectra of (B) C 1s, (C) O 1s, (D) N 1s.
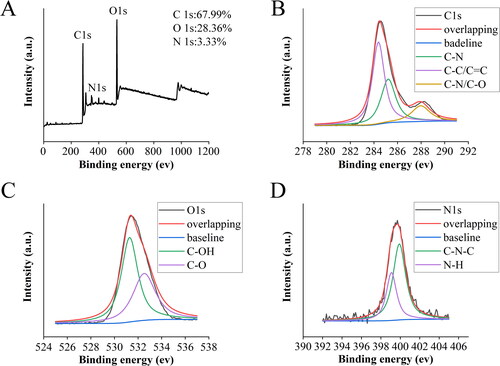
Figure 4. Cytotoxicity analysis in RAW264.7 cells treated with various doses of carbon dots derived from Rhei radix et rhizoma.
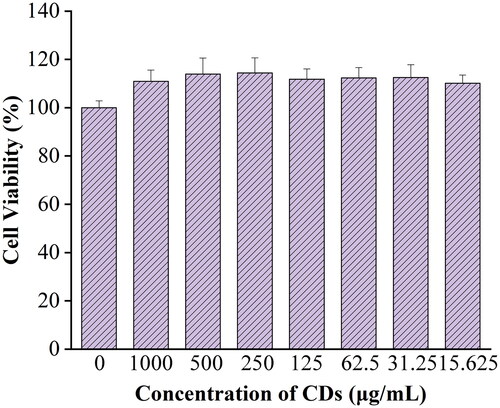
Figure 5. Hemostatic time of Rhei radix et rhizoma-carbon dots. Control: normal saline; HC: Hemocoagulase; H, M, L: high-, medium-, and low-dose (0.23, 0.12, and 0.06 mg/kg) RRR-CD-treated groups, respectively. **P<0.01 compared with the control group.
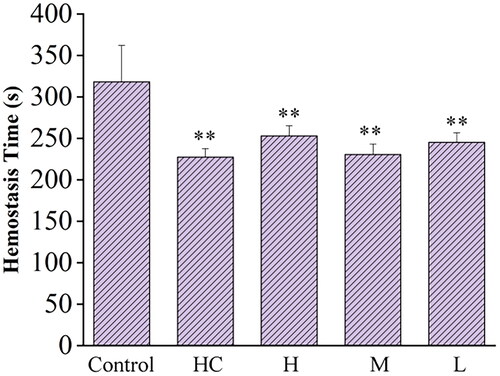
Figure 6. Effects of Rhei radix et rhizoma-carbon dots on DSS-induced UC in mice. (A) Experimental schedule of the DSS-induced UC model in mice. (B) Body weight changes. (C) DAI score. (D) Colon length histogram. (E) Colon tissue photographs.Control: normal saline; SASP: Sulfasalazine; H, M, L: high-, medium-, and low-dose (0.23, 0.12, and 0.06 mg/kg) RRR-CDs-administered groups, respectively. Values are means ± SD, *p<0.05; **p<0.01 compared with the model group; ##p<0.01 compared with the control group.
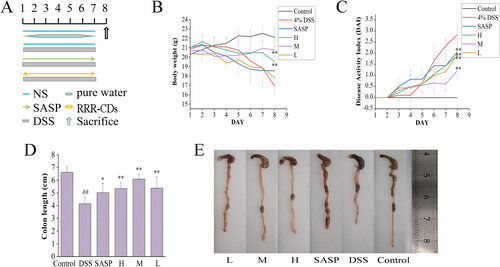
Figure 7. Rhei radix et rhizoma-carbon dots ameliorate the histological changes of DSS-induced UC in mice. Histopathological sections of each group (A-F) were stained with H&E, scale bar = 50μm, 200×; 100μm, 400×. (A) Control group [normal saline]. (B) Model group [DSS]. (C) Positive group [Sulfasalazine]. (D) RRR-CDs High-does group. (E) RRR-CDs Mediun-dose group. (F) RRR-CDs Low-dose group.
![Figure 7. Rhei radix et rhizoma-carbon dots ameliorate the histological changes of DSS-induced UC in mice. Histopathological sections of each group (A-F) were stained with H&E, scale bar = 50μm, 200×; 100μm, 400×. (A) Control group [normal saline]. (B) Model group [DSS]. (C) Positive group [Sulfasalazine]. (D) RRR-CDs High-does group. (E) RRR-CDs Mediun-dose group. (F) RRR-CDs Low-dose group.](/cms/asset/ecc71148-cd78-46af-bc0e-04bcde3b8426/ianb_a_2197947_f0007_c.jpg)
Figure 8. Effects of Rhei radix et rhizoma-carbon dots on the level of TNF-α, IL-6, and IL-10 in colon tissue. Mice were treated with NS, SASP, and different concentrations of Rhei radix et rhizoma carbonisata-derived carbon dots (H: 0.23; M: 0.12, L: 0.06 mg/kg). ##p<0.01 compared with the control group; *p<0.05; **p<0.01 compared with the model group. Values are means ± SD. Control: normal saline; SASP: Sulfasalazine; H: RRR-CDs high dose; M: RRR-CDs medium dose; L: RRR-CDs low dose.
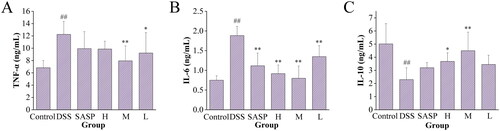
Figure 9. Effects of Rhei radix et rhizoma-carbon dots on the level of SOD, CAT, GSH, MPO, and MDA in colon tissue. Mice were treated with NS, SASP, and different concentrations of Rhei radix et rhizoma carbonisata-derived carbon dots (H:0.23; M:0.12, L:0.06 mg/kg). ##p<0.01 compared with the control group; *p<0.05; **p<0.01 compared with the model group. Values are means ± SD. Control: normal saline; SASP: Sulfasalazine; H: RRR-CDs high dose; M: RRR-CDs medium dose; L: RRR-CDs low dose.
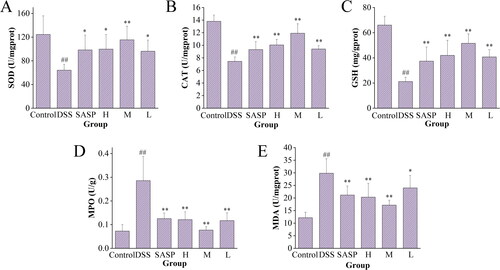
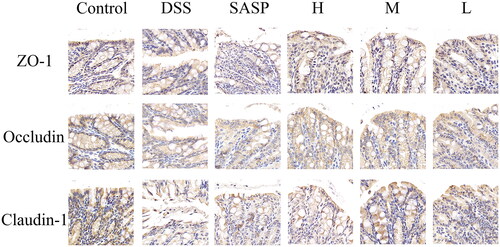
Figure 10. The expression of tight junction proteins in the intestinal tract of mice with UC. Antigen-antibody binding-stained sections. Scale bar = 20μm, 630×. Control: normal saline; SASP: Sulfasalazine; H, M, L: high-, medium-, and low-dose (0.23, 0.12, and 0.06 mg/kg) RRR-CDs-administered groups, respectively.
Data availability statement
All data generated or analysed during this study are included in this published article.