
Figures & data
Table 1. Total phenolic content and flavonoids in aqueous extract of C. aconitifolius. The results are shown for n = 3 determinations as the average ± standard error of mean (SEM).
Figure 1. UV – VIS spectrum for the synthesis of ZnO NPs. KEY: Zn acetate only: Zn2+ acetate only; Zn + NaOH: Zn2+ and NaOH; PE: Plant extracts; Zn + PE: Zn2+ + plant extracts; ZnO + PE + NaOH: Zn2+ +plant extracts + NaOH.
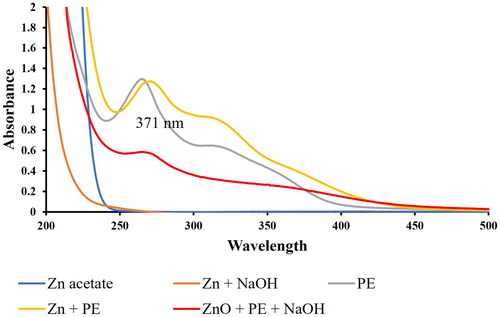
Figure 2. FT-IR Spectra of (a) C. aconitifolius extract. (b) Green ZnO NP.
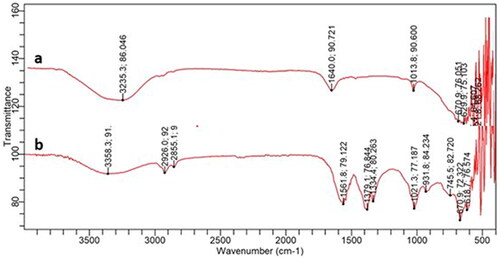
Figure 3. XRD Pattern of ZnO NPs.
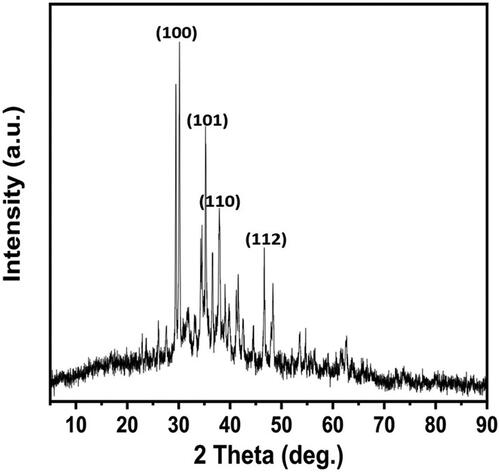
Figure 4. TEM Images of ZnO NPs.
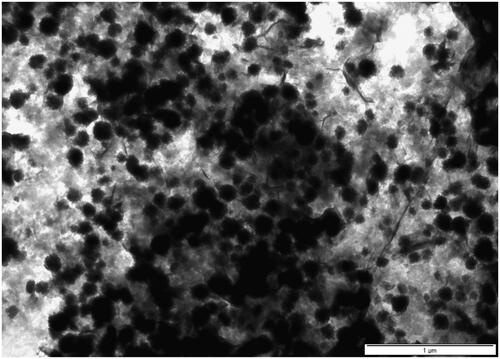
Figure 5. SEM Images of ZnO NPs.
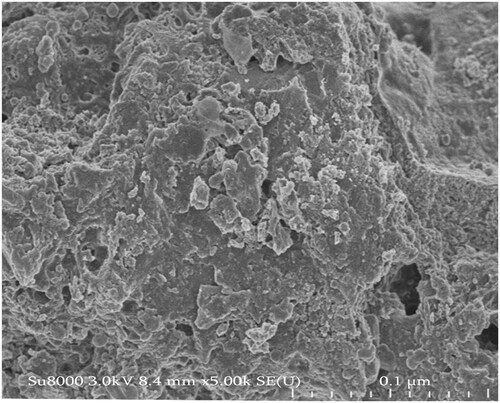
Figure 6. Length of Sorghum bicolour leaves treated after 10 days with ZnO NPs and NPK.
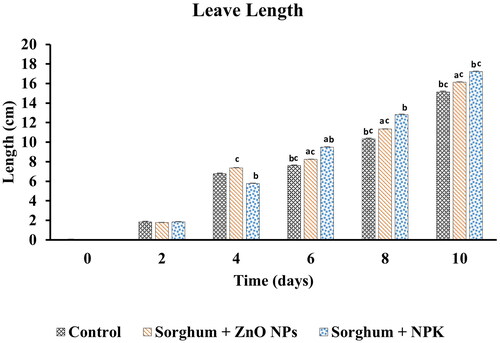
Figure 7. Total Chlorophyll Content of Sorghum bicolour leaves treated after 10 days with ZnO NPs and NPK.
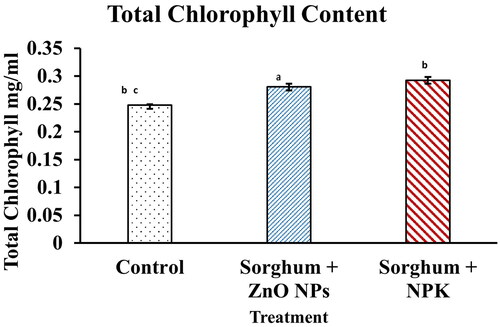
Figure 8. Superoxide dismutase activity of Sorghum bicolour shoots treated after 10 days with ZnO NPs and NPK.
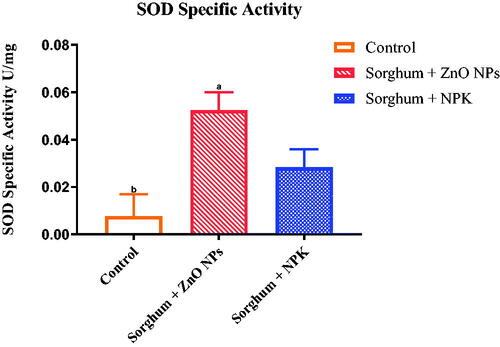
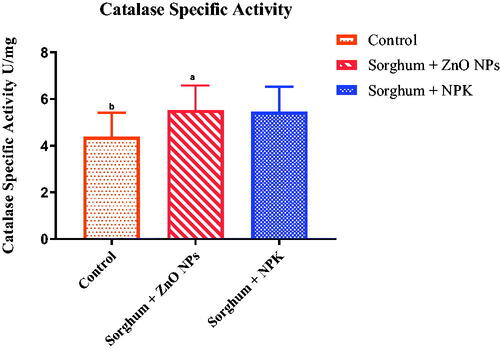
Figure 9. Catalase activity of Sorghum bicolour shoots treated after 10 days with ZnO NPs and NPK.
Data availability statement
The data that support the findings of this study are available from the corresponding author, R.S.D, upon reasonable request.