
Figures & data
Figure 1. Preparation and characterisation of curcumin nanoparticles. (A) Schematic representation shows the preparation of curcumin nanoparticles (Cur-NPs). (B) Comparison of UV-Visible spectra for the nanoparticles and non-encapsulated curcumin. (C) Size measurement of Cur-NPs using dynamic light scattering (DLS).
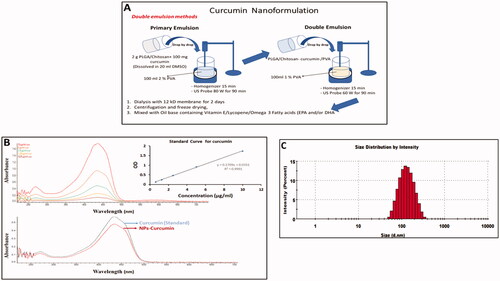
Figure 2. The effect of different concentrations of curcumin nanoparticles on cell proliferation of liver cancer Huh7 and HepG2 cells and THLE-2 as a control normal liver cell. Cells were treated with the indicated concentrations of the curcumin nanoparticles for (A) 24h and (B) 48h and curcumin (C) 48h, respectively, and cell proliferation was assessed by MTT assay in triplicates.
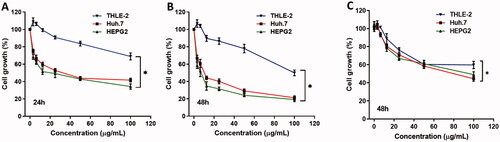
Figure 3. The effect of curcumin nanoparticles on cell migration using wound-healing assay. HepG-2 cells were treated with Cur-NPs for 24, and 48 h. Wounds were visualised using a converted microscope and the scale bar is 100 µm and images were analysed with ImageJ software. Data considered statistically significant at p < 0.05 regarding control nontreated cells and treatment after 24 and 48 h. All data are represented as mean ± SD from three independent experiments and analysed with two-way ANOVA, Data considered statistically significant at (***p ≤ 0.001) and (****p ≤ 0.0001).
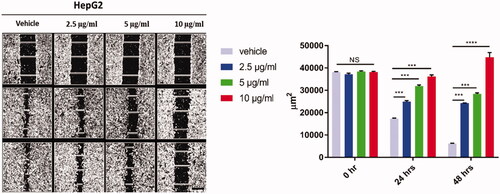
Figure 4. Effect of curcumin nanoparticles on the blood vessel formation using chick embryo. Fertile eggs were treated with and without cur-NPs and placed vertically in the trays inside the incubator for 4 days.
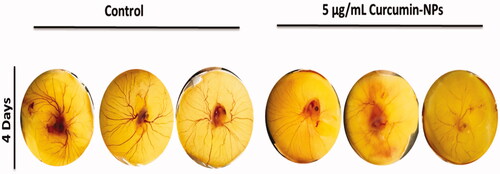
Figure 5. Effect of curcumin nanoparticles on gene and protein expressions. HepG-2 and HuH7cells were treated with Cur-NPs at the indicated concentrations for 48 h. (A–C) BAX, P53, and BCL-2 mRNA fold change in HepG2 cells, respectively and (D–F): BAX, P53, and BCL-2 mRNA fold change in Huh 7 cells, respectively. Data considered statistically significant at p < 0.05. Significance was calculated regarding cells treated 6.25 (a), 12.5 (b) and 25 µg/ml (c) of curcumin NPs compared to cells received DMSO. Experiments were conducted in triplicates and repeated at least twice.
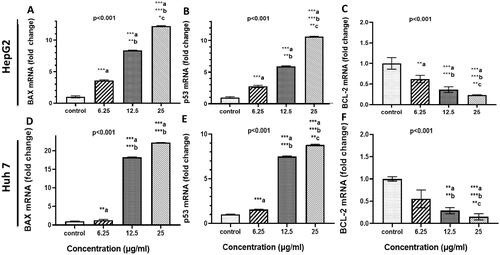
Figure 6. Effect of curcumin nanoparticles on cell apoptosis. Upper panel (A): bright field images showing the effect of different concentrations of cur-NPs (6.25, 12.5 and 25 µg/mL) on HepG2 cells. Lower panel (B): Apoptotic and necrotic cell death of HepG2 were assessed using Annexin V and 7AAD assay after 48 h treatment with curcumin NPs.
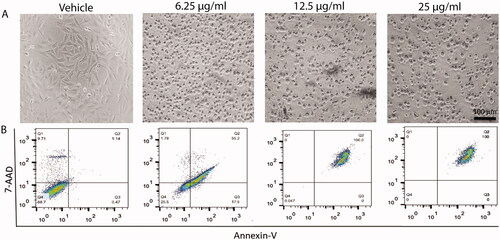
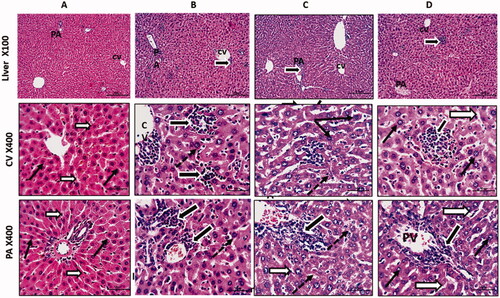
Figure 7. Anti-tumour activity of curcumin nanoparticles in mice engrafted Ehrlich solid carcinoma. Histological sections from liver stained with H&E and photographed at 100 with scale bar 200 µm and and 400X with scale bar 50 µm. Control group (A) shows normal central vein (CV) and portal vein (PV) regions with normal hepatocytes having rounded vesicular nuclei (black arrows) and separated by thin blood sinusoids (white arrows). Solid Ehrlich tumour group (B) shows a dilation of liver vessels (CV& PV), marked infiltration of hepatic sinusoids with malignant Ehrlich cells (thick black arrows), and hepatocytes showed large nuclei (dotted arrow). Solid Ehrlich tumour + Cis group (C) shows degenerated neoplastic cells with dark nuclei (thick black arrows). Hepatocytes showed large size nuclei or karyomegaly (dotted thin arrows). Others looked shrined with small dark degenerated nuclei (thin black arrow). Blood sinusoids are dilated with few inflammatory cells (white arrows). Solid Ehrlich tumour + Cis + Cur-NPs group(D) shows nearly normal hepatocyte with normal size and nuclear appearance. Hepatic blood sinusoids looked normal and not dilated (white arrows). Tumor cells still showed degrative changes (thick black arrows).
Data availability statement
The data sets used and/or analysed during this study are available from the corresponding author on reasonable request.