
Figures & data
Figure 1. Characterisation of synthesised IgGAuNPs and MTX-IgGAuNPs by (A) UV-Visible spectroscopy, (B) Transmission electron microscope of IgGAuNPs (Inset image) and MTX-IgGAuNPs, (C) Dynamic light scattering of IgGAuNPs (Inset image) and MTX-IgGAuNPs (D) Zeta potential of IgGAuNPs (Inset image) and MTX-IgGAuNPs (E) Changes in fluorescence intensity in IgGAuNPs during synthesis (excitation λ = 280nm emission λ = 320–380nm and 420–480nm) in the reaction mixture at different incubation time (0 h, 6 h, 12 h, 24 h) as well as IgG pure and IgG + vinca, (F) UV-Visible spectroscopy graph of pure methotrexate at different concentration for drug loading efficiency.
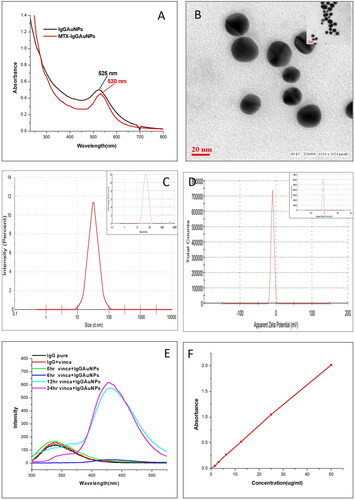
Figure 2. the cytotoxicity (dose-dependent) study of IgGAuNPs, pure methotrexate, and MTX-IgGAuNPs against A549 cells and NRK cells.
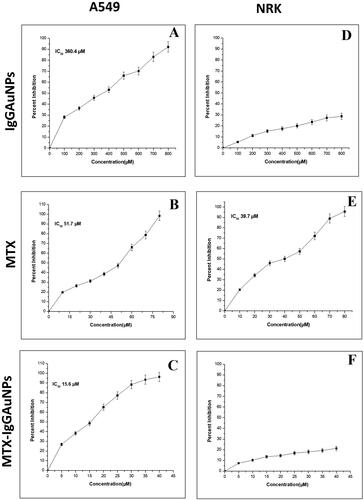
Figure 3. Image showing cytotoxic effect of (A) untreated control, (B) IgGAuNPs treated cells, (C) MTX treated cells, and (D) MTX-IgGAuNPs treated cells against A549 cells at their respective IC50 concentrations at Scale bar = 50 µM; 10X magnification.
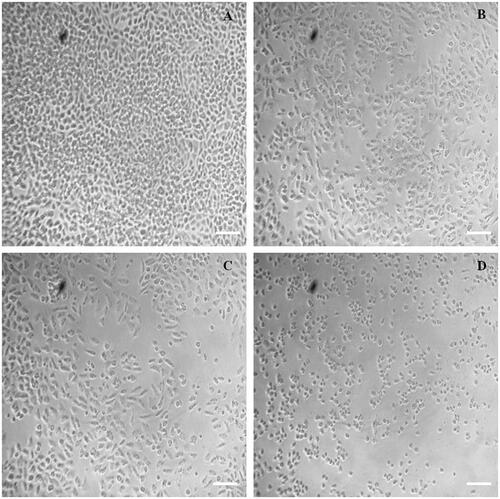
Figure 4. Images showing DCFDA staining under phase contrast microscope after 24 h of treatment on A549 cells at their respective IC50 concentrations at Scale bar = 50 µM; 20X magnification. (A) Control of DCFDA, (B) IgGAuNPs treated cells, (C) MTX treated cells, (D) MTX-IgGAuNPs treated cells, and (E) Graph showing change in intensity of DCFDA stained control, IgGAuNPs, MTX, and MTX-IgGAuNPs treated cells.
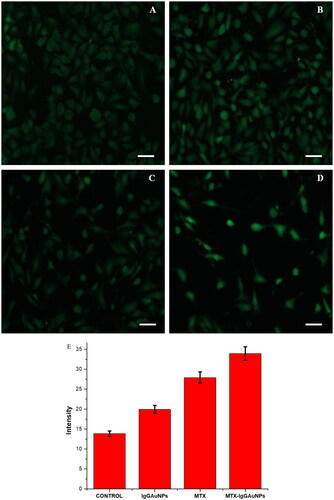
Figure 5. Images showing DAPI staining under phase contrast microscope after 24 h of treatment on A549 cells at their respective IC50 concentrations at Scale bar = 50 µM; 20X magnification. (A) Control of DAPI, (B) IgGAuNPs treated cells, (C) MTX treated cells, (D) MTX-IgGAuNPs treated cells, and (E) Graph showing change in intensity of DAPI stained control IgGAuNPs, MTX, and MTX-IgGAuNPs treated cells.
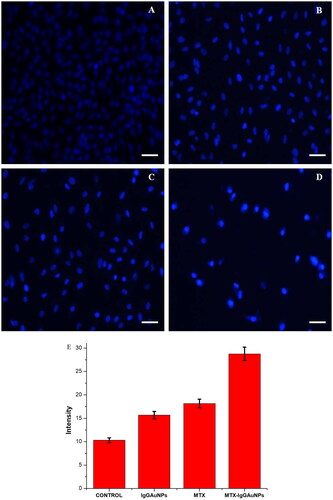
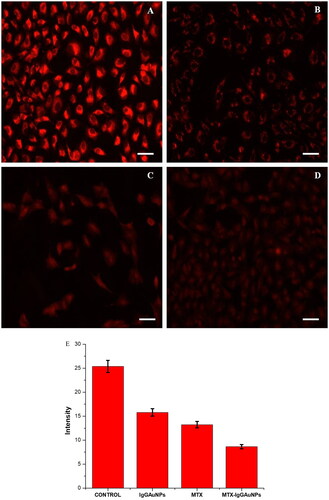
Figure 6. Mitochondrial depolarisation by disrupting mitochondrial membrane potential (DWm) in A549 cells and images observed by staining with Mitotracker Red CMXROS at Scale bar = 50 µM; 20X magnification. (A) Untreated control cells, (B) IgGAuNPs treated cells, (C) MTX treated cells, (D) MTX-IgGAuNPs treated cells, at their respective IC50 concentrations, and (E) Graph showing change in intensity of Mitotracker Red CMXROS stained control, IgGAuNPs, MTX, and MTX-IgGAuNPs treated cells.
Data availability statement
The data that support the findings of this study are available from the corresponding author, SAR, upon reasonable request.