
Figures & data
Figure 1. The machine learning framework for high-throughput characterization of cellular states and ecosystems in MCC. (A) Overview of the application of EcoTyper to cellular states and ecosystems profiling in MCC. (B) UMAP projection of cellular states across MCC tumour patients. (C) The proportions of patients within different cellular states in each cell type. (D) The sankey diagram showing the relationship of epithelial cellular states, tissue, and merkel cell polyomavirus status.
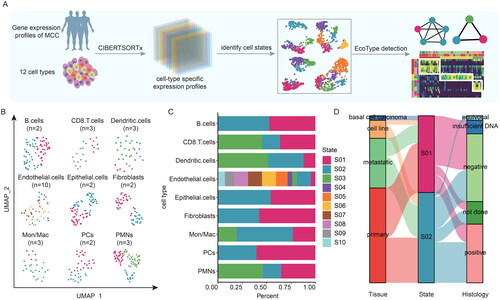
Figure 2. The cellular states landscape of B cell and CD8 T cell in MCC. (A-B) Heatmap depicting cellular states of B cells and CD8 T cells identified from MCC bulk transcriptomes. Patient samples are organized by the most prevalent cell states and genes used for identification of the cell states are shown. (A) for two B cell states. (B) for three CD8 T cell states. (C-D) a sankey diagram showed the relationship of cellular states, tissue, and merkel cell polyomavirus status. (C) for B cell states. (D) for CD8 T cell states. (E) Boxplot showing the expressions of WDFY4, CD19, CD38 and MS4A1 in patients within B cell states. (F) Boxplot showing the expressions of IL16, IL2RB, IL18BP and MPEG1 in patients within CD8 T cell states. (G) Barplots showing the enriched functional pathways for genes highly expressed in B cell S01 and CD8 T cell S01.
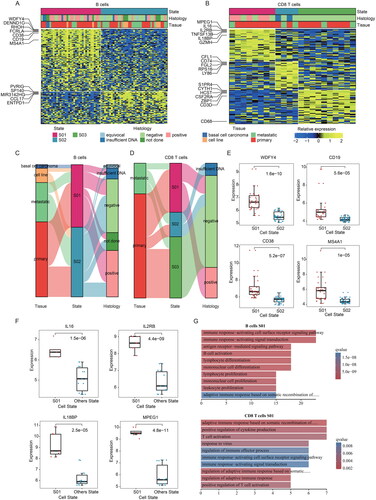
Figure 3. The cellular states landscape of fibroblasts and monocytes/macrophages in MCC. (A) Heatmap depicting fibroblasts cell states identified from MCC bulk transcriptomes. (B) The sankey diagram showed the relationship of fibroblasts cellular states, tissue, and merkel cell polyomavirus status. (C) Barplots showing the enriched functional pathways for genes highly expressed in S01 states and S02 states of fibroblasts. (D) Heatmap depicting Mon/mac cell states identified from MCC bulk transcriptomes. (E) Heatmap showing the expression of the top the most prevalent genes in three Mon/mac cell states.
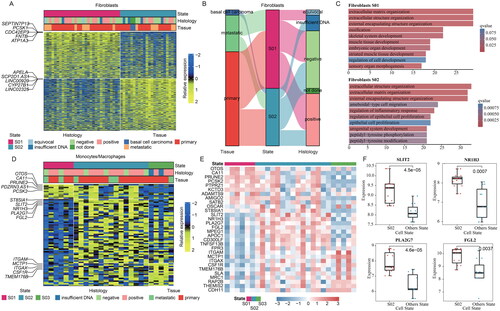
Figure 4. Comprehensive functional profiling of cellular states in MCC. (A) Circos plot showing the cancer hallmark and immune-related pathways enriched genes highly expressed in cellular states in MCC. The cell states of each cell type are shown on the left and pathways are on the right, widths of the links indicate the proportion of genes enriched in pathways. (B) Scatter plot showing the normalized enrichment scores (NES) of pathways in epithelial cells S01. Pathways are ranked by NES. Colours of dots are corresponding to the p-values. (C) The enrichment score (ES) distribution for the genes differentially expressed in epithelial cells S01 enriched in five pathways. Each line is for a pathway.
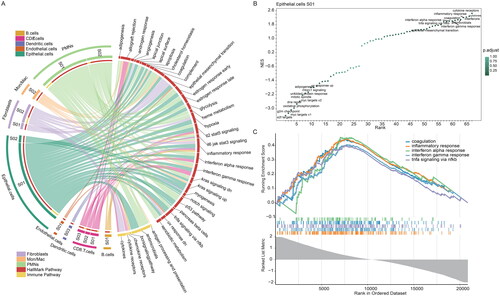
Figure 5. Landscape of cellular ecosystems in MCC. (A) Cellular state abundance patterns of MCC patients, with cell states organized into four ecotypes and tumour samples (columns) ordered by the most abundant ecotype per sample. (B) The proportions of cell types in four ecotypes in MCC. (C) Sankey diagram showing distribution of cellular states in four ecotypes. (D) Network organization of cellular states in four ecotypes. (E) Sankey diagram showing the relationship of four ecotypes, tissue, and merkel cell polyomavirus status. (F) Molecular characteristics of four ecotypes. The abundance of cell types in four ecotypes (top), the functional pathways of four ecotypes (bottom).
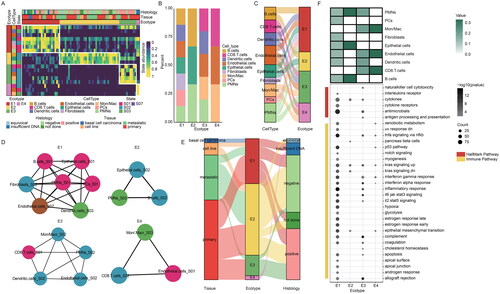
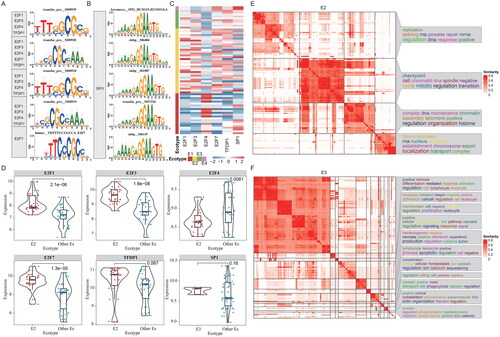
Figure 6. Transcriptional regulators of ecosystems in MCC. (A-B) Representative TFs potentially regulating the genes highly expressed in corresponding ecotypes. Top five TFs were shown for each ecotype of MCC. (A) for E1 and (B) for E3. (C) Heatmap showing the expressions of TFs across patients within different ecotypes. (D) Boxplots showing the expressions of representative TFs. (E-F) Functional enrichment of the target genes of transcription factors. GO terms were clustered into groups based on gene similarities. (E) for E2 and (F) for E3.
Data availability statement
Public gene expression profiles used in this work can be acquired from Gene Expression Omnibus (GEO, http://www.ncbi.nlm.nih.gov/geo/). The datasets used and/or analyzed during the present study are available from the corresponding authors on reasonable request.