Figures & data
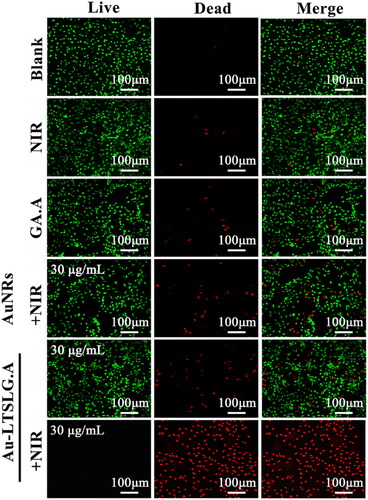
Figure 5. Fluorescence microscopic images of MCF-7 cells incubated with different treatment and subsequent brief staining. The blank group was PBS. Cells treated with NIR irradiation, GA.A (30 µg/mL), Au NRsþNIR irradiation (30 µg/mL), Au-LTSL-GA.A (30 µg/mL) were set as control groups. Cells were treated with Au-LTSLGA. A (30 µg/mL) for 2 h in incubation and measured for 5 min upon irradiation (0.25 W/cm2). Cells were stained (for 30 min) with Calcein-AM and PI for anticancer activity.