
Figures & data
Figure 1. (A) Schematic of the denudation setup. (B) The structure of native artery with intact EC layer from H&E and immunofluorescent (IF) staining. (C) The structure of denuded artery with EC free area. Scale bars 500 µm and 200 μm (for H&E); 100 μm and 25 μm (for IF staining).
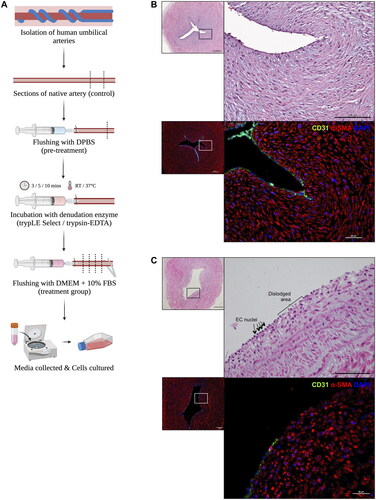
Figure 2. (A,B) Representative staining of CD31 and αSMA on denudation protocol using trypLE Select and trypsin-EDTA at RT and 37 °C with its Respective incubation period. (C,D) Quantification of EC coverage post denudation protocol at RT and 37 °C respectively. ** p < 0.01 and * p < 0.05 compared to native artery using two-way ANOVA. (N = 4; Scale bar: 100 μm).
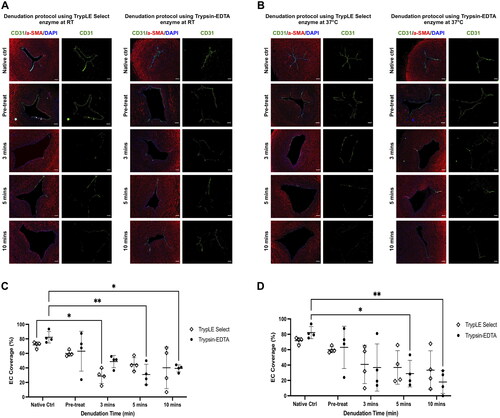
Figure 3. (A,B) Representative image of Alcian blue staining from denudation using trypLE Select and trypsin-EDTA enzyme at RT and 37 °C. (C,D) Intensity analysis of Alcian blue at RT and 37 °C respectively. ** p < 0.01 compared to native tissue using two-way ANOVA. (N = 4, scale bar: 200 μm).
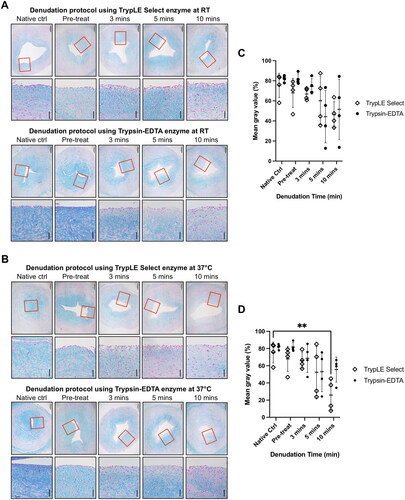
Figure 4. (A) Intima-media thickness of denuded hUA at day 0 and after cultured for 7 days (B). (C) Result shows non-significant increase of intima-media thickness at day 7 compared to day 0. L = lumen (paired t-test, N = 5, scale bar 200 μm) (D) immunophenotype of isolated cells is CD31+CD146+vWF+VEGFR2+αSMA-. (Scale bar: 100 μm).
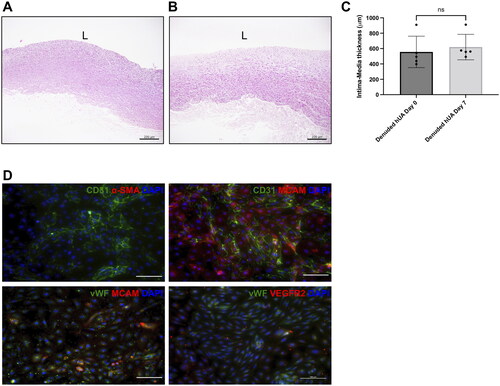
Table 1. Comparison of chemical and mechanical endothelial denudation.
Supplemental Material
Download MS Word (128.5 KB)Data availability statement
The data that support the findings of this study are available from the corresponding author, [NS], upon reasonable request.