
Figures & data
Figure 1. (A) Particle size and (B) Zeta potential of metformin-loaded nanoemulsion.
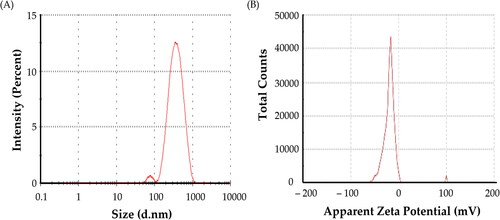
Table 1. Physicochemical characteristics of nanoemulsion formulations.
Figure 2. The cumulative metformin release metformin-loaded coconut oil nanoemulsion and non-formulated metformin permeated through the membrane for 6 h. Each data point represents the mean ± SD (n = 3).
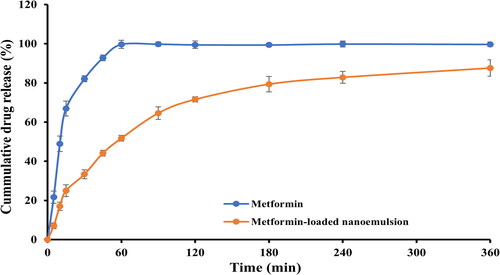
Table 2. Stability profile of formulated nanoemulsion after three months.
Figure 3. Cell viability of MCF-7 following treatment with various concentrations (0–100 μg/mL) of either metformin, coconut oil nanoemulsion, or metformin-loaded coconut oil nanoemulsion for 72 h. data represent mean ± SD.
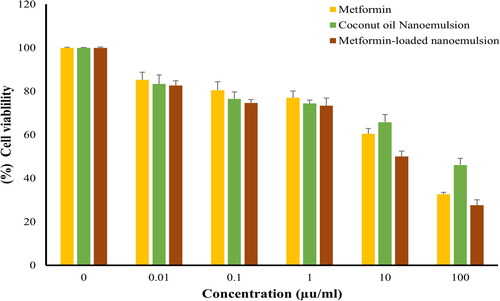
Figure 4. Cell viability of HePG-2 following treatment with various concentrations (0–100 μg/mL) of either metformin, coconut oil nanoemulsion, or metformin-loaded coconut oil nanoemulsion for 72 h. data represent mean ± SD.
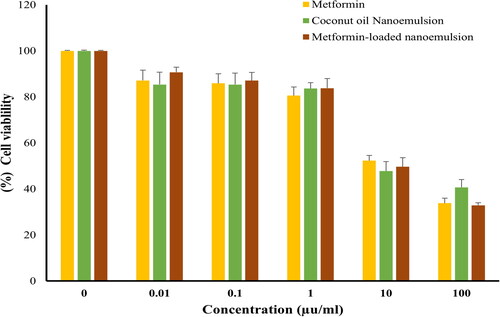
Figure 5. Cell viability of HCT116, following treatment with various concentrations (0–100 μg/mL) of either metformin, coconut oil nanoemulsion, or metformin-loaded coconut oil nanoemulsion for 72 h. data represent mean ± SD.
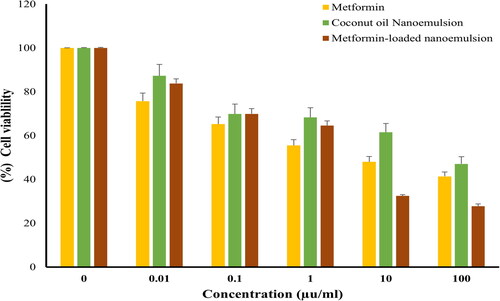
Table 3. The IC50 of different formulations against different human Solid tumour cells.
Figure 6. Effect of metformin-loaded coconut oil nanoemulsion on cell cycle distributions of MCF-7, HepG2, and HCT 116 cells. Cell cycle distribution was determined using flow cytometry analysis after exposure to treatment for 48 h. Data are presented as the mean ± SD. * p < 0.05 and ** p < 0.01.
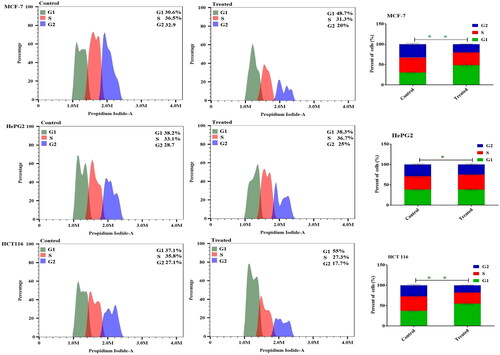
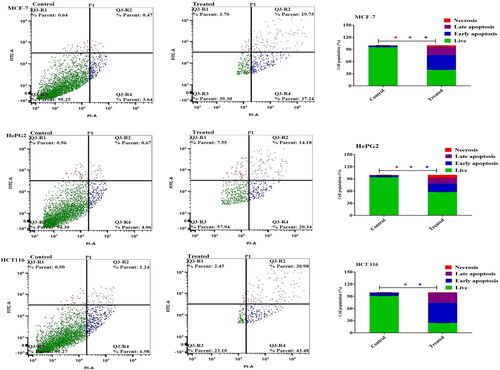
Figure 7. Cellular apoptosis of MCF-7, HePG2, and HCT 116 treated with metformin-loaded nanoemulsion for 48h. Dot plots depict apoptotic cell distribution following annexin V-FITC/PI staining. Column charts represent a quantitative evaluation of apoptotic cell percentage post-Metformin-loaded nanoemulsion treatment. Data are presented as the mean ± SD.
Data availability statement
All data generated or analyzed during this study are included in this published article.