
Figures & data
Figure 1. Large-scale transcriptome analyses reveal viral infection-related genes. (A) Number of DEGs of viral infections in the corresponding dataset. The heatmap shows the number of differential genes identified from different datasets, and the bar chart shows the number of samples in the control and virus-infected groups in each cohort. (B) Heatmap showing the expression profile of Rhinovirus markers in different datasets. (C) Heatmap showing the expression profile of RSV markers in different datasets. (D) Heatmap showing the expression profile of Influenza markers in different datasets.
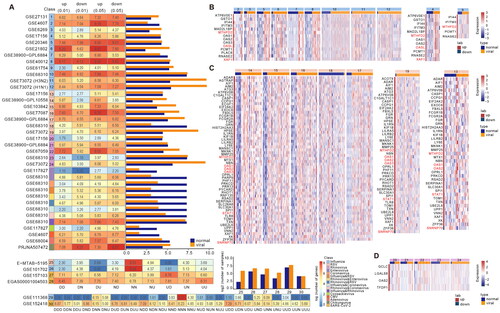
Figure 2. Classification of viral infection based on robust gene biomarkers. (A) ROC curves of SARS-COV-2 molecular markers in different datasets. (B) ROC curves of Rhinovirus molecular markers in different datasets. (C) ROC curves of RSV molecular markers in different datasets. (D) ROC curves of Influenza molecular markers in different datasets. (E-H) ROC curves of corresponding viral molecular markers in the validation dataset.
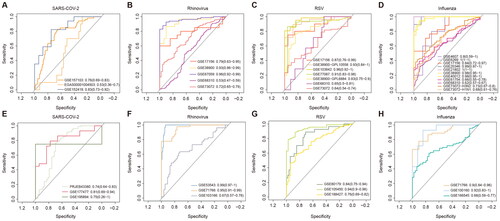
Figure 3. Network analysis of respiratory infection viruses-related genes. (A) Protein interactions of four of 16 viral proteins in the HPRD network. The colours of the nodes represent different viruses, including nodes that are associated with multiple viruses. The size of the node is proportional to the number of viruses associated. (B-D) Topological properties of the viral infection-related genes and others in the PPI network. (E-G) Topological properties of genes associated with multiple virus infections and genes associated with single virus infections.
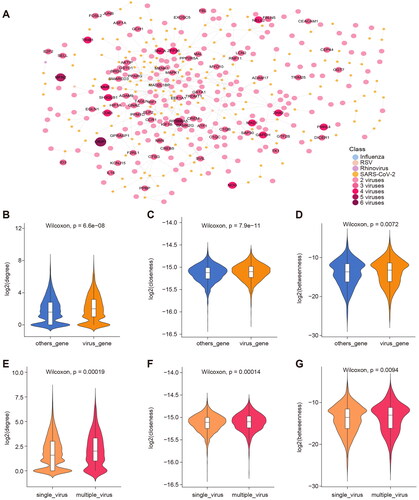
Figure 4. Functional pathways of viral infection-related genes. (A) Consensus BP function of respiratory tract infection viruses, * indicates p-value < 0.01. (B) Correlation between different viral BP functions. The x-axis is the BP function of the virus, and the ordinate is the target protein of the virus extracted with a threshold FDR < 0.01. (C) Correlation between different viral BP functions. The x-axis is the BP function of the virus, and the ordinate is the target protein of the virus extracted with a threshold FDR < 0.05. The position of the dot represents the similarity between functions related to viral infection, and the colour of the dot represents the similarity between genes related to viral infection.
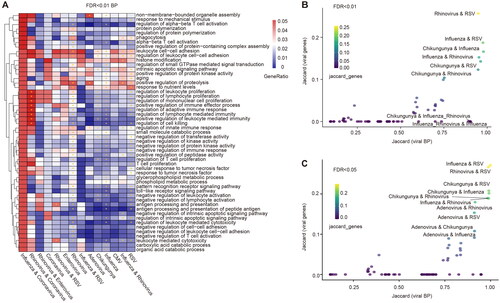
Figure 5. Human tissues associated with viral infections. (A) Visualization of the literature association of respiratory infection viruses and related tissues. The green dots represent viruses. The pink dots represent tissue, and the larger nodes represent more viruses associated with them. The thickness of the degree is proportional to the amount of relevant literature, and the red line represents the retrieval in the MVIP database. (B) Network visualization showing the PPIs among Influenza viral interacting proteins and brain tissue associated proteins. Orange nodes represent virus-related target proteins, and pink nodes represent brain tissue-related proteins.
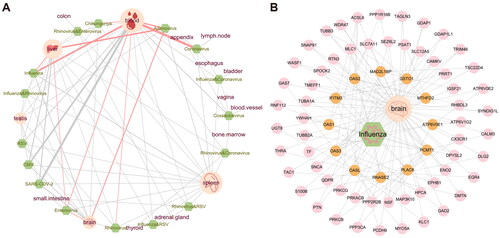
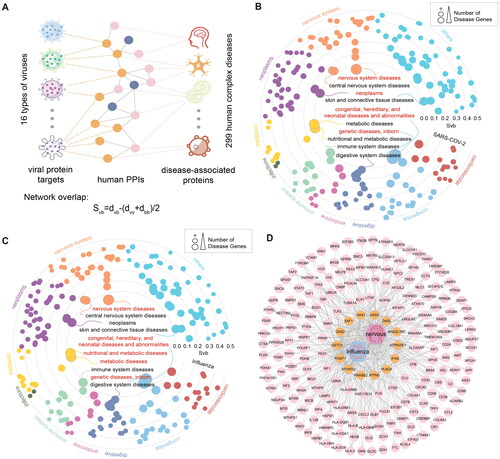
Figure 6. Diseases comorbidities associated with viral infections. (A) Disease comorbidity measured by the network overlap between respiratory virus infections-related protein coding genes and 299 diseases. (B) Association of SARS-COV-2 with 299 diseases. The dots represent diseases whose radius reflects the number of associated diseases genes. The diseases closest to the centre, whose names are marked are expected to have higher comorbidity with viral infection. Red labels represent (C) Diseases associations based on Influenza-correlated genes. (D) Network visualization showing the PPIs among Influenza viral interacting proteins and nervous system diseases associated proteins. Orange nodes represent virus-related target proteins, and pink nodes represent brain tissue-related proteins.
Supplemental Material
Download MS Word (4.4 MB)Supplemental Material
Download MS Excel (49.1 KB)Supplemental Material
Download MS Excel (16.3 KB)Data availability statement
Public gene expression profiles used in this work can be acquired from Gene Expression Omnibus (GEO, http://www.ncbi.nlm.nih.gov/geo/), ArrayExpress (https://www.ebi.ac.uk/biostudies/arrayexpress), European Genome-phenome Archive (EGA, https://ega-archive.org/) and BioSample (http://www.ncbi.nlm.nih.gov/biosample/). The datasets used and/or analyzed during the present study are available from the corresponding authors upon reasonable request.