
Figures & data
Figure 1. Immunization and library construction. (a) SDS-PAGE analyses of HpaA purification. (b) The schematic depicts shark immunization. (c) Immune response in white-spotted bamboo shark evaluated by ELISA. The values showed the average of three replicates. (d) Detection of a positive rate of VNAR library phage by colony PCR; 1–20: randomly selected colonies.
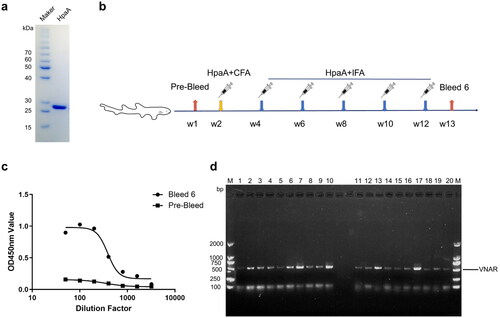
Figure 2. Screening of VNAR against HpaA from the immune library. (a) Polyclonal phage ELISA for detection of enrichment in each round of biopanning. (b) Monoclonal phage ELISA for detecting anti-HpaA phage. (c) The amino acid sequences of the selected VNARs. FR is the framework region; HV is a hypervariable region. Canonical cysteine residues are red.
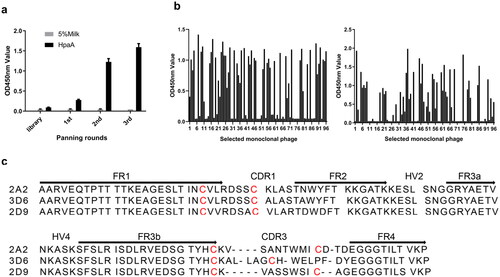
Figure 3. Expression and purification of anti-HpaA VNARs. (a) Schematic diagram of VNAR produced in E. coli BL21(DE3) strain. (b) SDS-PAGE analysis of expression and purification of VNAR. Lane M: protein marker, Lane 1: supernatant of the bacteria lysate, Lane 2: penetrating liquid, Lane 3-5: washing buffer with 20, 50, and 75 mM imidazole, and Lane 6-10: elution buffer with 100, 150, 200, 250, 300 mM imidazole; (c) SDS-PAGE analysis of the molecular weight of anti-HpaA VNAR purification.
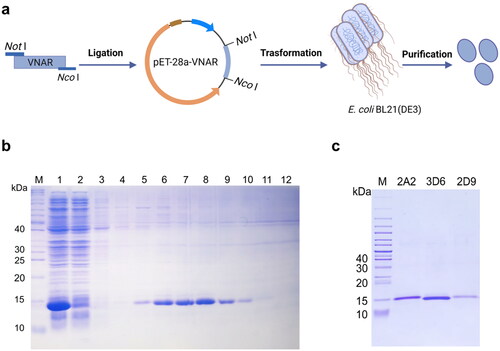
Figure 4. The binding of VNARs to HpaA. (a) ELISA Measurement of 3 isolated VNARs against HpaA. The values were the mean ± standard deviation of three well replicates. (b)-(d) The BLI binding kinetics of 2A2 (b), 3D6 (c), 2D9 (d), respectively.
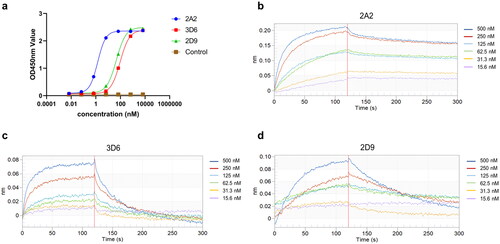
Table 1. Binding kinetics of VNARs selected against HpaA.
Figure 5. ELISA detection of VNARs binding to H. pylori 26695 bacteria. The values were the mean ± SD of three replicates.
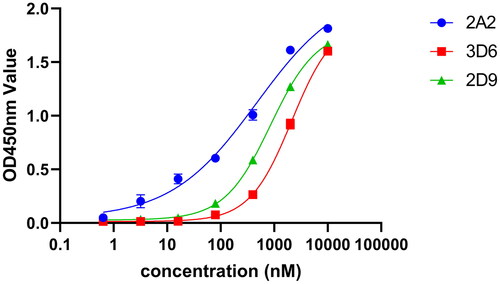
Figure 6. Model of VNAR-HpaA complex. (a) Competitive ELISA of biotinylated 2A2 vs. 2A2, 3D6, 2D9 on HpaA. (b) Structure representations of HpaA and 2A2; HpaA is coloured cyan, and 2A2 is coloured blue. (c) Stereo view of HpaA-2A2 interactions; Hydrogen bonding is coloured red. (d) Structure representations of HpaA and 3D6, HpaA is coloured cyan, and 3D6 is coloured yellow. (e) Stereo view of HpaA-3D6 interactions; Hydrogen bonding is coloured red.
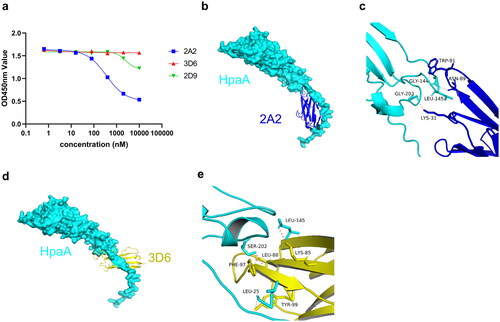
Figure 7. Characteristics of bivalent VNAR. (a) Schematic representation of bivalent VNAR. (b) SDS-PAGE analysis of bivalent VNARs purified. (c) ELISA analysis of binding affinity of bivalent VNARs to HpaA. (d) The binding capability of bivalent VNARs to HpaA in different pH buffers. The values were the mean ± SD of three replicates.
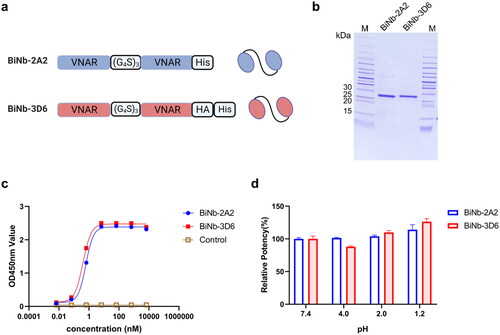
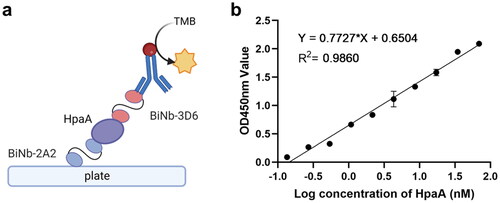
Figure 8. Development of bivalent VNAR-based sandwich-ELISA. (a) Schematic representation of sandwich-ELISA. (b) Linear standard curve of sandwich-ELISA used to detect HpaA protein. The values were the average of three replicates.
Data availability statement
The data that support the findings of this study are available from the corresponding author, Y.G., upon reasonable request.