
Figures & data
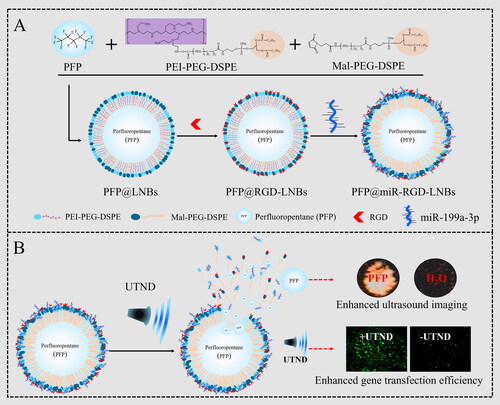
Scheme 1. Schematic illustration of UTND-responsive LNBs for HCC therapy: (A) preparation of PFP@miR-RGD-LNBs; (B) UTND-mediated release of ultrasound imaging agent and therapeutic miRNA from PFP@miR-RGD-LNBs.
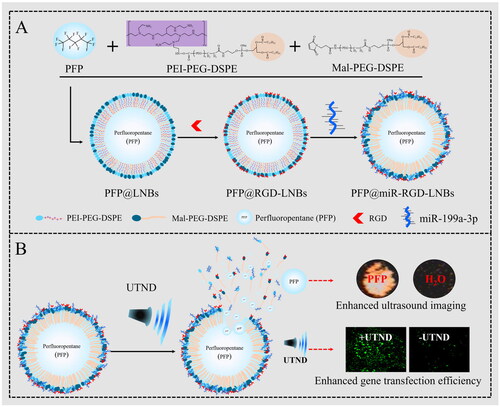
Table 1. Primers for qRT-PCR.
Figure 1. Characterization of the prepared LNBs: (A) TEM image of PFP@miR-LNBs, scale bar 200 nm; (B) TEM image of PFP@miR-RGD-LNBs, scale bar 200 nm; (C) size distribution of PFP@miR-LNBs; (D) size distribution of PFP@miR-RGD-LNBs; (E) size of the prepared LNBs complex changed with time (n = 7 days) when stored at 4 °C; (F) zeta potential of the prepared LNBs complex changed with time (n = 7 days).
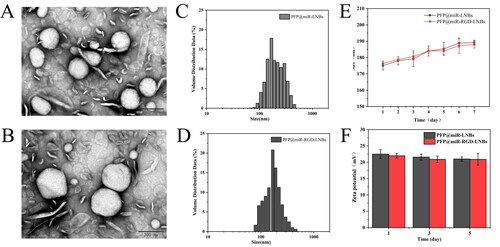
Table 2. Zeta potential of the prepared LNBs.
Figure 2. Agarose gel electrophoresis assay. (A) Evaluation of miRNA condensation ability of LNBs using agarose gel retardation experiment: LNBs and miRNA were mixed at various mass ratios, including 0, 2:1, 4:1, 6:1, 8:1, 10:1, 12:1, and 14:1. (B) Assessment of RNase protection capability of LNBs, using electrophoretic mobility analysis of LNBs complexes following RNaseA enzyme digestion.
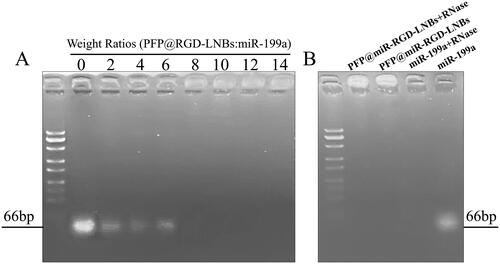
Figure 3. In vitro release profiles of miRNA from PFP@miR-RGD-LNBs with or without the promotion of LIFU (output power of 0.8, 1.6 or 2.4 W/cm2, 1 MHz, duty cycle of 50% and an exposure time of 60 s) at 37 °C, pH 7.4.
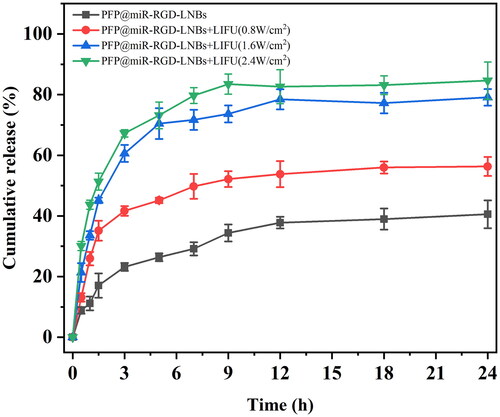
Figure 4. LIFU-mediated gene transfection in vitro. The LIFU were set at different power levels of 0, 0.8, 1.6 or 2.4 W/cm2, with a frequency of 1 MHz and a 50% duty cycle for 60 s. After 48 h of further incubation, GFP expression in the cells was investigated using a fluorescence microscope.
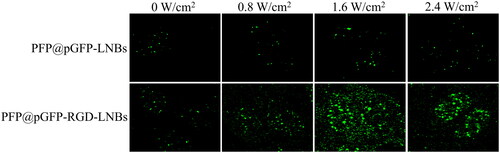
Figure 5. Relative expression levels of miR-199a-3p in HepG2 cells measured by qRT-PCR. The cells were treated with a series of gene-loaded LNBs, where LNBs-to-miRNA mass ratios were set at 8:1, 10:1, 12:1 and 16:1. Subsequently, the cells underwent LIFU treatment at 1.6 W/cm2 power levels, a 1 MHz frequency and a 50% duty cycle for 60 s.
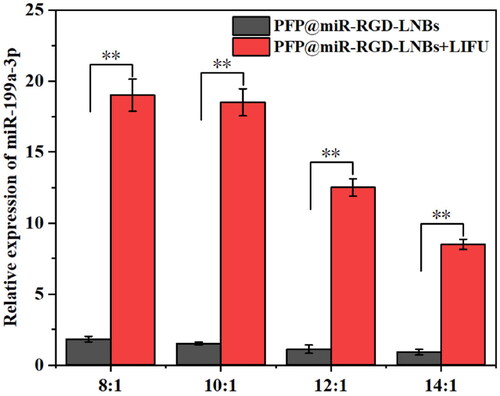
Figure 6. Evaluation of ultrasound imaging performance of PFP@miR-RGD-LNBs. (A) Ultrasound images of LNBs at different PFP concentrations in vitro. (B) Quantitative analysis of ultrasound relative signal intensity at various PFP concentrations.
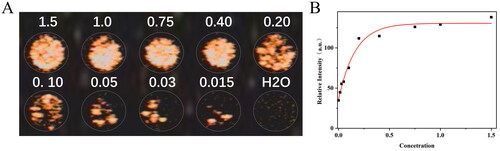
Figure 7. Cell viability of different cells treated with the prepared LNBs at various concentrations, as measured by the CCK-8 assay. (A) Viability of L02 cells treated with the prepared LNBs; (B) viability of L929 cells treated with the prepared LNBs. The LIFU treatment parameters were set at 1.6 W/cm2 power levels, 1 MHz frequency, and 50% duty cycle for 60 s.
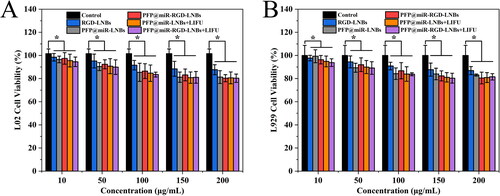
Figure 8. Evaluation of the anti-cancer effects of LNPs on HepG2 cells. CCK-8 assay results showing cell viability at 24 h (A) and 48 h (B) following LNBs treatments. (C) Flow cytometry analysis of apoptosis in HepG2 cells 24 h post treatment. LIFU parameters for the treated groups were set at 1.6 W/cm2 power levels, 1 MHz frequency, 50% duty cycle, with an exposure time of 60 s.
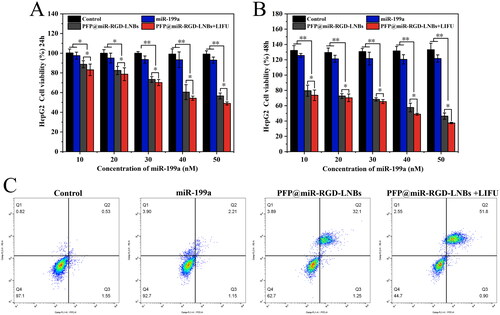
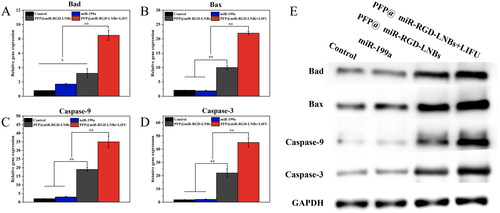
Figure 9. Comparative expression of apoptosis markers in HepG2 cells after various treatments. Panels (A–D) represented the mRNA expression levels of Bad (A), Bax (B), Caspase-9 (C) and Caspase-3 (D). Panel (E) showed the Western Blot images reflecting the protein expression of these markers across different treatment groups: control, miR199a, PFP@miR-RGD-LNBs and PFP@miR-RGD-LNBs + LIFU. Cells were co-incubated with the specified LNBs formulations for 48 h, with some groups receiving LIFU treatment as designated.
Data availability statement
The data that support the findings of this study are available from the corresponding author, X.G., upon reasonable request.