
Figures & data
Figure 1. (A) Strobilanthes crispus leaves that were used in the study; (B) biosynthesis of AgNP mediated with S. crispus at 24h.
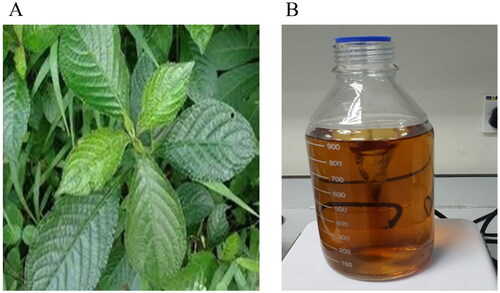
Figure 2. Characterization of SC-AgNPs. (A) UV-Vis spectra of S. crispus leaves water extract at 4.5 mg/mL; (B): UV-Vis spectra of SC-AgNPs at 4.5 mg/mL; (C) FESEM images of SC-AgNPS at 50,000 × magnification; (D) XRD spectra of SC-AgNPs; (E) FTIR analysis of commercial AgNPs, S. crispus aqueous extract and SC-AgNPs.
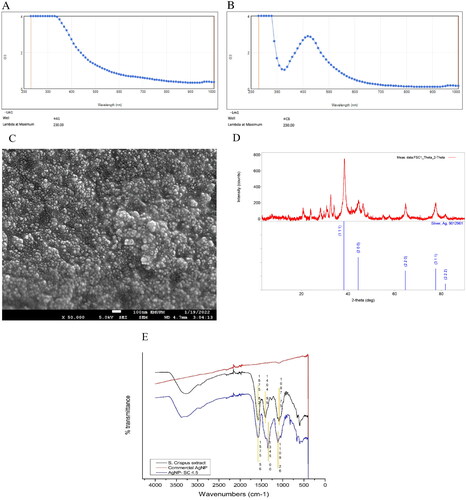
Table 1. Particle size and zeta potential analysis.
Table 2. Zone inhibition of bacteria after exposure to SC-AgNPs, AgNP, S. crispus water extract and gentamicin.
Table 3. MIC and MBC of SC-AgNPs, AgNP and S. crispus water extract against E. coli, P. aeruginosa and S. mutans.
Figure 3. (A) the growth of P. aeruginosa, (B) E. coli, (C) S. mutans (log10 Cfu/mL) after being treated with SC-AgNPs, AgNP and S. crispus water extract at 0, 4, 8, 12 and 24 h. The samples were analyzed in triplicate and data were presented as means ± standard deviation.
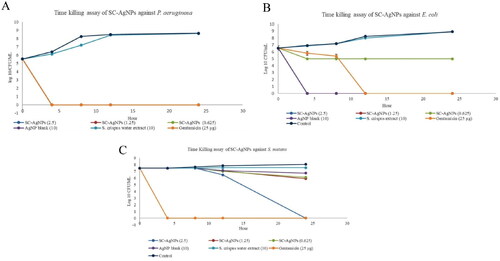
Figure 4. (A) Morphology of non-treated E. coli, (B) morphology of E. coli after being treated with SC-AgNPs (1.25 mg/mL) and (C) morphology of E. coli after being treated with SC-AgNPs (0.625 mg/mL). Non-treated E. coli was rod in shape, meanwhile, E. coli treated with SC-AgNPs was smaller, shrunken and irregular in shape.
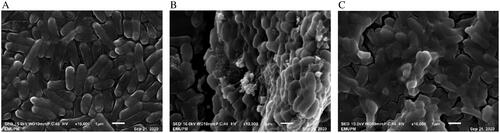
Figure 5. (A) Morphology of non-treated P. aeruginosa, (B) morphology of P. aeruginosa after being treated with SC-AgNPs (0.625 mg/mL) and (C) morphology of P. aeruginosa after being treated with SC-AgNPs (1.25 mg/mL). Non-treated P. aeruginosa was rod in shape, meanwhile, P. aeruginosa treated with SC-AgNPs was found lysed and shrunken.
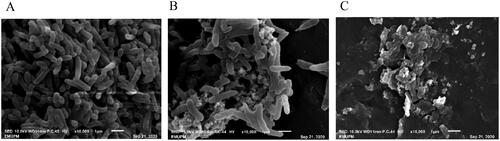
Figure 6. (A) Morphology of non-treated S. mutans, (B) morphology of S. mutans after being treated with SC-AgNPs (2.5 mg/mL) and (C) morphology of S. mutans after being treated with SC-AgNPs (1.25 mg/mL). Non-treated S. mutans was coccus in shape, meanwhile, S. mutans treated with SC-AgNPs was smaller and irregular in shape.
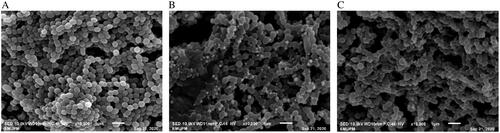
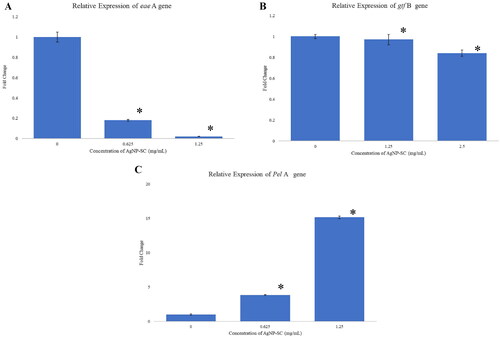
Figure 7. (A) The relative expression of eae a gene in E. coli, (B) gtf B gene in S. mutans and (C) Pel a gene in P. aeruginosa after being treated with SC-AgNPs. The samples were analyzed in triplicate and data were presented as means ± standard deviation. The fold change value of treated genes showed significant differences (p < 0.05) when compared to control (*).
Data availability statement
The data are available from the corresponding author upon reasonable request. The whole methodology is included in the materials and methods section.