
Figures & data
Figure 1. Experimental Illustration and animal grouping.
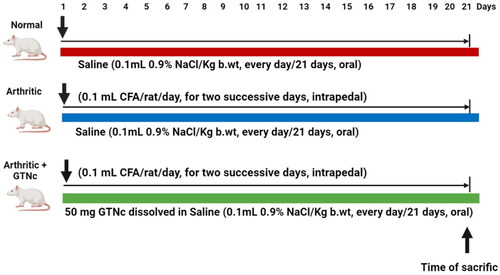
Table 1. Primers used for TGF-β gene expression.
Figure 2. FT-IR (A) and XRD (B) of GTNc.
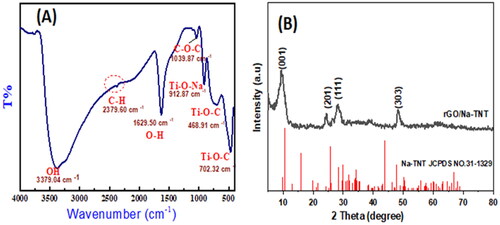
Figure 3. (A), (B) SEM images, and (C) EDX of GTNc.
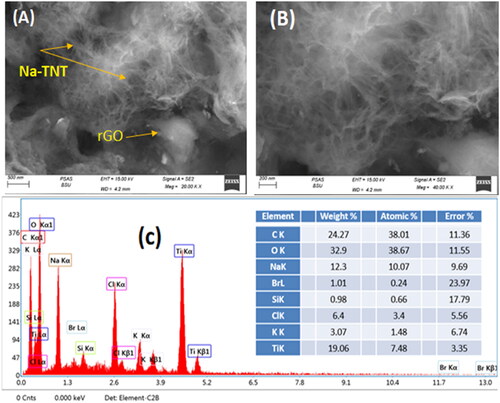
Figure 4. Nitrogen adsorption–desorption isotherms of GTNc.
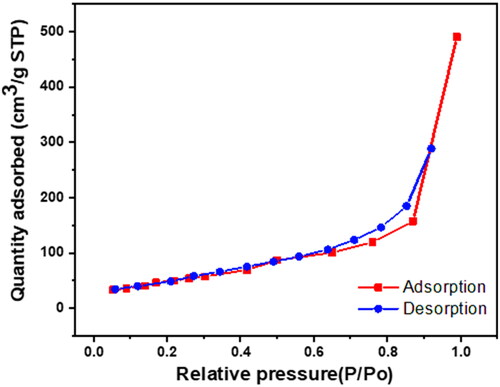
Table 2. Textural parameters of GTNc.
Figure 5. Zeta potential distribution (A) and size distribution (B) of GTNc.
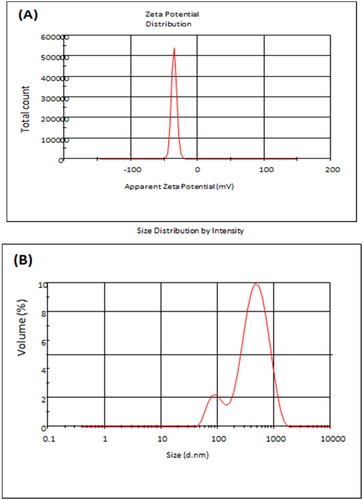
Figure 6. Gross morphology of the right hind paw and ankle of rats from various groups demonstrates swelling and inflammation. (A) rats without arthritis, (B) rats with arthritis, and (C) rats with arthritis that were given GTNc.
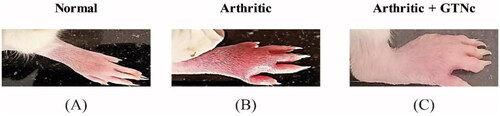
Figure 7. Effect of GTNc on the size of the right hind paws of rats with CFA-induced arthritis. Results are presented as mean values ± SE. *p < 0.05: significant difference compared to the control group, #p < 0.05: significant compared to GTNc-treated arthritic rats.
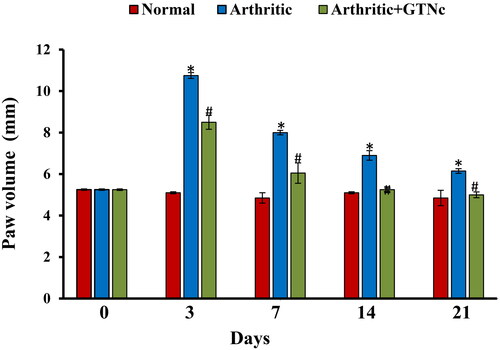
Figure 8. The influence of GTNc on serum ratio of (A) RF, (B) CRP, (C) TNF-α, (D) IL-1β, (E) IL-17, and (F) IL-4 levels. Results are presented as mean values ± SE. *p < 0.05: significant difference compared to the control group, #p < 0.05: significant compared to GTNc-treated arthritic rats.
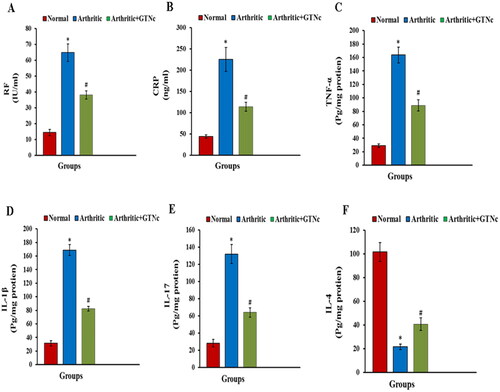
Figure 9. Influence of GTNc on serum levels (A) ADAMTS-5 and (B) TIMP-3. Results are presented as mean values ± SE. *p < 0.05: significant difference compared to the control group, #p < 0.05: significant compared to GTNc-treated arthritic rats.
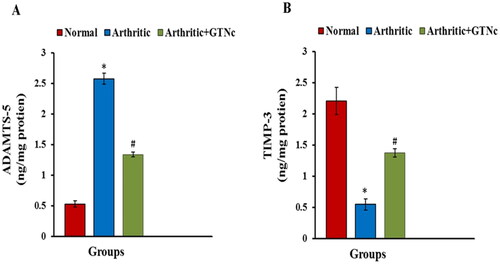
Figure 10. Influence of GTNc on TGF-β mRNA expression. Results are presented as mean values ± SE. *p < 0.05: significant difference compared to the control group, #p < 0.05: significant compared to GTNc-treated arthritic rats.
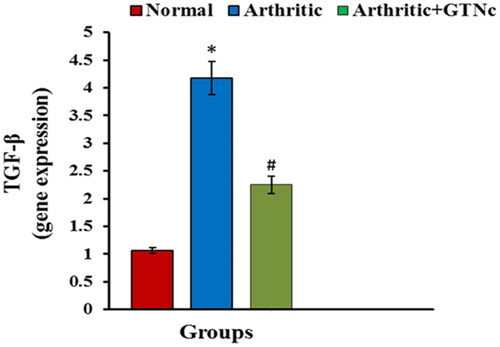
Figure 11. Influence of GTNc on LPO and GSH arthritic content, as well as GST activity. Results are presented as mean values ± SE. *p < 0.05: significant difference compared to the control group, #p < 0.05: significant compared to GTNc-treated arthritic rats.
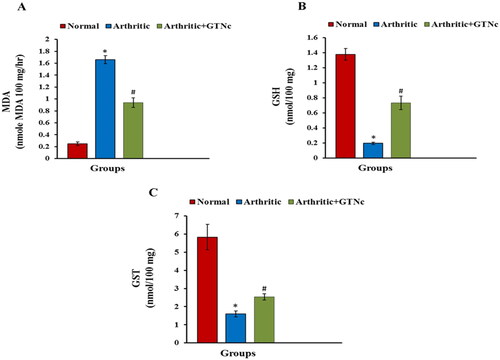
Figure 12. In control negative normal rats (a), higher power view showing average synovial lining with a single layer of flat synovial cells (black arrow) and intermediate sub-synovial connective tissue (blue arrow) and average blood vessels (red arrow) (H&E X 400). in control positive arthritic rats (B), high power view showing destructing pannus on and on menisci (red arrow) and a yellow arrow pointing to a sub-synovial inflammatory infiltrate (H&E X 200). in GTNc (C), showing small non-destructing pannus on articular cartilage (black arrow) and intact synovial lining (red arrow) with mild sub-synovial inflammatory infiltrate (blue arrow) (H&E X 200).
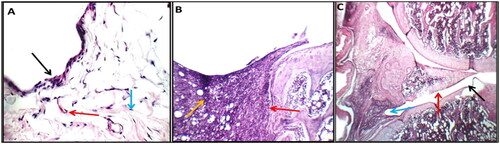
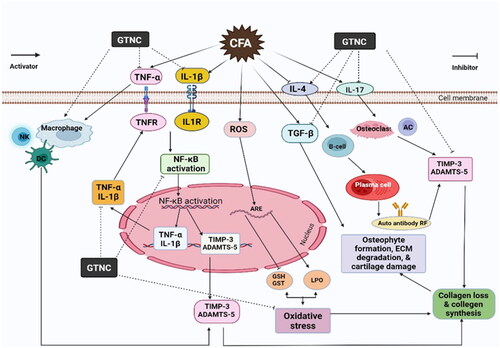
Figure 13. Schematic figure showing the mechanisms of actions of GTNc in arthritic rats.
Supplemental Material
Download MS Word (5 MB)Data availability Statement
All data can be found in the article.