
Figures & data
Figure 1. UV Characterization and MTT cytotoxicity assay of Prakasine. A UV Spectral Analysis of PRK-NP synthesis. Ultraviolet-visible absorption spectra of CHCl3 in black line is blank,HgS in green line and HgSDLM in red line reveal the PRK-NP complex formation. Citation1B, C, D, E, and F : MTT assay of Prakasine. The MTT assay reveals that there is no significant toxicity of PRK-NP in HEK293 cell line experiment even though the negligible toxicity in 320ug PRK-NP dose might be due to DMSO.
Abbreviations: PRK-NP-: Prakasine, CHCl3: chloroform, HgS: Mercury Sulphide, HgSDLM: Mercury Sulphide DL-Methionine.
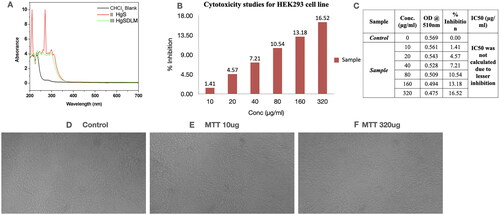
Figure 2. Acridine Orange/ethidium Bromide (AO/EB) staining assay to detect apoptosis.
: Apoptosis study of Prakasine. The apoptosis study of Prakasine reveals that the Prakasine does not induce significant apoptosis in HEK293 cell line experiments with negligible necrotic cells in 320µg/mL PRK-NP dosage might be due to DMSO. Viable cells _ Green fluorescence. Necrotic cells with orange stain (short arrow), Late apoptotic cells with yellow green staining (Long arrow)
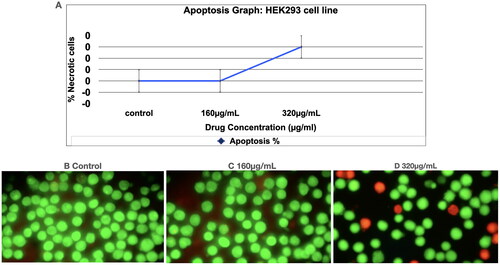
Figure 3. Non-cytolytic anti-Cancer activity and non-cytotoxicity of Prakasine by SBR assay. A, and C indicate that Prakasine does not have cytolytic anti-cancer activity and cytotoxicity in MCF-7 cell line culture as there is a 100% cell growth. The B is the control, The C, D, E and F are Prakasine, Doxorubicin, Paclitaxel and Positive control, ADR. The ADR is the ACTREC’s positive control as per institute protocols. The percentages of cell growth are 100%, −38%, −50% and −49% in Prakasine, Doxorubicin, Paclitaxel and positive control, ADR respectively compared with control. ADR: Adriamycin, ACTREC : Advanced Centre for Treatment, Research & Education in Cancer
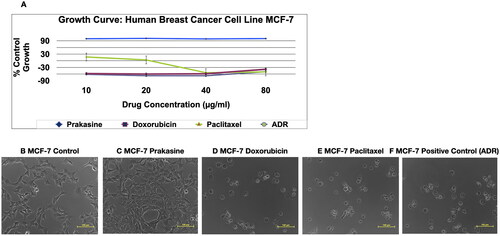
Figure 4. Maximum Tolerated Dose Evaluation of Prakasine.
Note: Toxicity Criteria: Mor and weight loss….
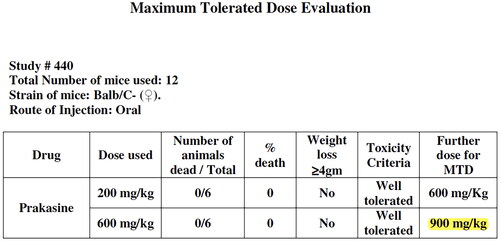
Table 1. Toxicological study in Wistar albino rats for the duration of 18 months (the readings are average values of triplicates of four animals in control and ten animals in trials from blood samples).
Table 2. Toxicological study in New Zealand White rabbits for the duration of 18 months (the readings are average values of triplicates of four animals in control and ten animals in trials from blood samples).
Table 3. Toxicological study in Rajapalayam dogs for the duration of 18 months (the readings are average values of triplicates of four animals in control and ten animals in trials from blood samples).
Figure 5. Relative tumor volume and activity Criteria of Murine mammary tumor model treated with Prakasine for 32 days. A: The RTV of A, B, C, D, and E are 23.17, 9.87, 6.23, 16.26, and 14.86 respectively after 32 days of Prakasine treatment. The reduced values of 16.26 and 14.86 of D and E indicate that the Prakasine has reduced the tumour volume compare to control 23.17. (p < 0.05). B: The 32nd day T/C value of B, C, D, and E are 0.43, 0.27, 0.70 and 0.64 respectively indicate that the Prakasine is having lower tumour reduction effect compare to ADR and Paclitaxel, (p < 0.05) RTV: Relative Tumour Volume on day of measurement/Tumour Volume on day 1.*T/C: Tumour/ Control, * ADR - Adriamycin, ACTREC: Advanced Centre forTreatment,Research & Education in Cancer.
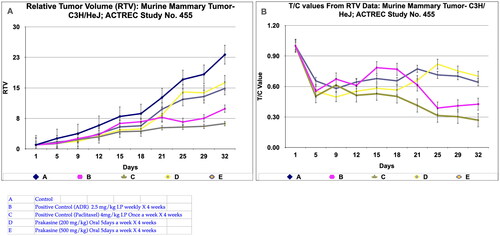
Figure 6. Survival and animal body weight (grams) data of Murine mammary Tumour- C3H/HeJ model treated with Prakasine for 32 days. A: All the groups from A-E, the animals survival rate is 100% in the study duration of 32 days. B: The Prakasine treated groups D and E is slightly having more weight gain compared to A, B and C groups indicates the efficacy of the Prakasine in the study duration of 32 days.
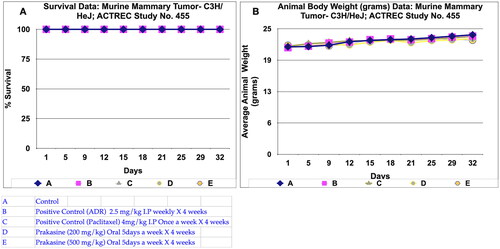
Figure 7. Tumour volume of group a and tumor volume of group B data of Murine mammary Tumour- C3H/HeJ model treated with Prakasine for 32 days. A and B: In both the group A and B the tumour volume has increased gradually in all the six animals from 1st day to 32nd day.
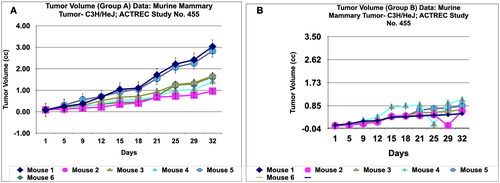
Figure 8. Tumour volume of group C and tumor volume of group D data of Murine mammary Tumour- C3H/HeJ model treated with Prakasine for 32 days. A and B: In both the group C and D the tumour volume has increased gradually in all the six animals from 1st day to 32nd day.
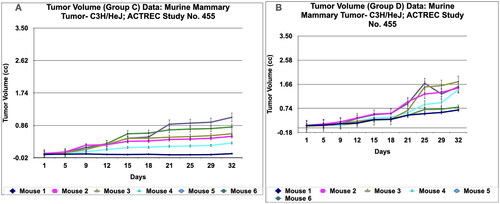
Figure 9. Tumour volume of group E data of Murine mammary Tumour- C3H/HeJ model treated with Prakasine for 32 days. In the group E the tumour volume has increased gradually in all the six animals from 1st day to 32nd day.
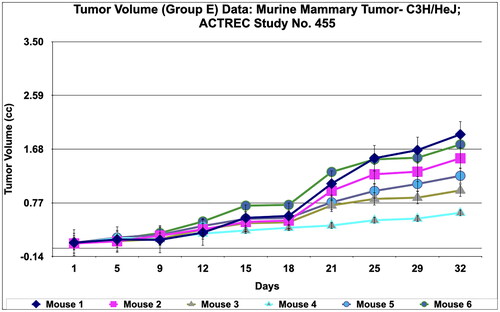
Figure 10. Relative tumor volume and activity Criteria of human tumor Xenograft - MCF-7 mice model treated with Prakasine for 23 days. A: The RTV of A, B, C, D, and E are 116.8, 42.81, 96.94, 90.24, and 33.44 respectively after 23 days of treatment with Prakasine. The reduced values of 90.24 and 33.44 of D and E indicate that the Prakasine has reduced the tumour volume compare to control 116.8 (p < 0.05). B: The 23nd day T/C value of B, C, D, and E are 0.37,0.83, 0.77 and 0.29 respectively indicate that the Prakasine is having better tumour reduction effect compare to ADR and Paclitaxel in group E, (p < 0.05). RTV = Relative Tumour Volume = Tumour Volume on day of easurement/Tumour Volume on day 1.*T/C: Tumour/ Control, * ADR: Adriamycin, ACTREC : Advanced Centre for Treatment, Research & Education in Cancer.
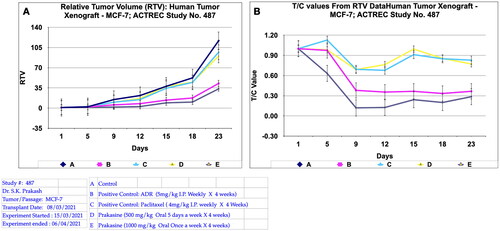
Figure 11. Survival and animal body weight (grams) data of human tumor Xenograft - MCF-7 mice model treated with Prakasine for 23 days. A : All the groups from A -E except B , the animals survival rate is 100% in the study duration of 23days. B : The Prakasine treated groups D and E is slightly having more weight gain compared to A, B and C groups indicates the efficacy of the Prakasine in the study duration of 23 days.
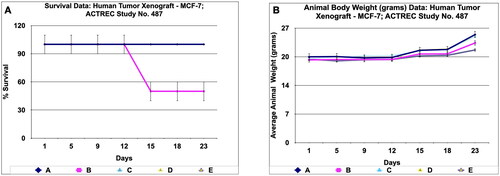
Figure 12. Tumour volume of group a and tumor volume of group B data of human tumor Xenograft - MCF-7 mice model treated with Prakasine for 23 days. A and B : In both the group A and B the tumour volume has increased gradually in all the six animals from 1st day to 23rd day.
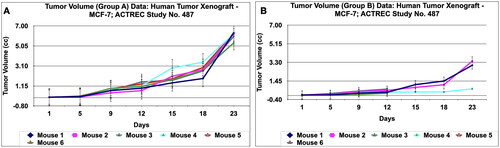
Figure 13. Tumour volume of group C and tumor volume of group D data of human tumor Xenograft - MCF-7 mice model treated with Prakasine for 23 days. A and B : In both the group C and D the tumour volume has increased gradually in all the six animals from 1st day to 23 rd day.
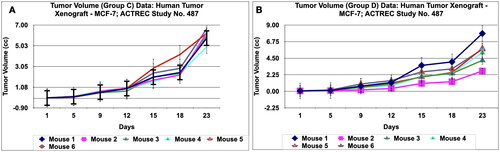
Figure 14. Tumour volume of group E data of human tumor Xenograft - MCF-7 mice model treated with Prakasine for 23 days. In the group E the tumour volume has increased gradually in all the six animals from 1st day to 23 nd day.
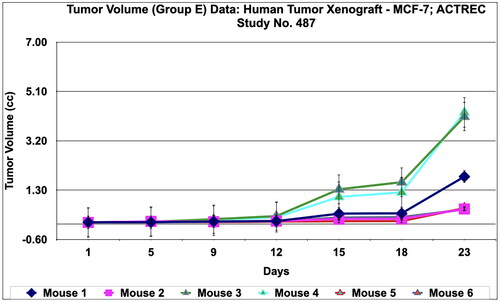
Figure 15. Proposed mechanism of Prakasine in HIV and cancer cell destruction.
The increased CD8+ T cells by the stimulation of Prakasine gets sensitised with cancer and HIV antigens and become Cancer Specific Cytotoxic T-Lymphocytes (CS-CTL) and HIV Specific Cytotoxic T-Lymphocytes (HS-CTL). These CS-CTL and HS-CTL kills cancer and HIV.
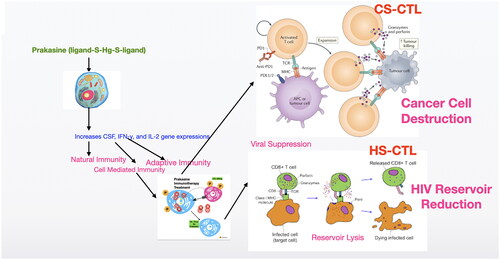
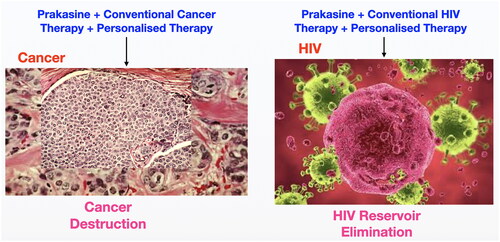
Figure 16. Possible strategies to cure HIV and cancer with Prakasine.
Data availability statement
The data that support the findings of this study are available from the corresponding author, [Prakash SK], upon reasonable request.