
Figures & data
Table 1. Physical and mechanical properties of Ti-6Al-4V titanium alloy fabricated by electron beam melting (EBM) with different unit cell structures [Citation20].
Figure 1. (a) CAD files and (b) scanning electron micrographs of different unit cell elements with (c) stress-strain plots showing brittle (cubic and rhombic dodecahedron) and ductile (G7) characteristics of unit cells. (d) Compression deformation behaviour showing different deformation modes and angle of fracture/crush bands for cubic (bucking and 90), G7 (bending and 45), and rhombic dodecahedron (bending and 45) unit cell elements [adapted from reference Citation20].
![Figure 1. (a) CAD files and (b) scanning electron micrographs of different unit cell elements with (c) stress-strain plots showing brittle (cubic and rhombic dodecahedron) and ductile (G7) characteristics of unit cells. (d) Compression deformation behaviour showing different deformation modes and angle of fracture/crush bands for cubic (bucking and 90), G7 (bending and 45), and rhombic dodecahedron (bending and 45) unit cell elements [adapted from reference Citation20].](/cms/asset/87dc38fc-5a14-4363-b440-ef8caab20bfc/ianb_a_2278156_f0001_c.jpg)
Figure 2. Finite volume method (FVM) stress analysis of graded and gradient mesh structures performed using ANSYS software, indicating the stress discontinuity along the interface between the two different layers in graded mesh (G1-G2 and G2-G3) during deformation. Such discontinuities were absent in gradient mesh structures [adapted from reference Citation21].
![Figure 2. Finite volume method (FVM) stress analysis of graded and gradient mesh structures performed using ANSYS software, indicating the stress discontinuity along the interface between the two different layers in graded mesh (G1-G2 and G2-G3) during deformation. Such discontinuities were absent in gradient mesh structures [adapted from reference Citation21].](/cms/asset/c541dfce-3f37-4f9a-83d9-24d1c3e32a2a/ianb_a_2278156_f0002_c.jpg)
Figure 3. Graded and uniform cellular structures (physical models and cellular structures) [adapted from reference Citation22].
![Figure 3. Graded and uniform cellular structures (physical models and cellular structures) [adapted from reference Citation22].](/cms/asset/10703ed8-ff1f-44df-9f96-eaa62bee32d0/ianb_a_2278156_f0003_c.jpg)
Figure 4. Strain accumulation curves under the same stress level. (a) 2 MPa and (b) 3.8 MPa [adapted from reference Citation22].
![Figure 4. Strain accumulation curves under the same stress level. (a) 2 MPa and (b) 3.8 MPa [adapted from reference Citation22].](/cms/asset/a5c0fcf5-c1b0-44c2-ba98-d3eb37e1200c/ianb_a_2278156_f0004_c.jpg)
Figure 5. Cubic, G7 and rhombic dodecahedron unit cells (a–c) and corresponding Ti-6Al-4V prototype structures processed by electron beam melting (d–f), and (g–i) are the schematic illustration of buckling and bending vectors of applied stress on cell struts. (j) stress versus number of cycles to failure of mesh structures with cubic, G7 and rhombic dodecahedron structures [adapted from reference Citation23].
![Figure 5. Cubic, G7 and rhombic dodecahedron unit cells (a–c) and corresponding Ti-6Al-4V prototype structures processed by electron beam melting (d–f), and (g–i) are the schematic illustration of buckling and bending vectors of applied stress on cell struts. (j) stress versus number of cycles to failure of mesh structures with cubic, G7 and rhombic dodecahedron structures [adapted from reference Citation23].](/cms/asset/c250837e-7096-4778-b10b-18380155e797/ianb_a_2278156_f0005_c.jpg)
Figure 6. Scanning electron micrographs of Ti-6Al-4V cellular structures with different porosity fabricated by electron beam melting (EBM) and corresponding osteoblast function [adapted from references Citation36,Citation37].
![Figure 6. Scanning electron micrographs of Ti-6Al-4V cellular structures with different porosity fabricated by electron beam melting (EBM) and corresponding osteoblast function [adapted from references Citation36,Citation37].](/cms/asset/a1783f5d-649a-4267-a5fc-ffde94193a13/ianb_a_2278156_f0006_b.jpg)
Figure 7. Computer-aided design profile of micro-arc oxidised Ti-6Al-4V alloy cellular structure (also referred as mesh structure) and SEM of micropores grown on the strut surface, bioactive apatite formation, and osteoblast-micropore interaction. Also presented are the fluorescent micrograph showing cell adhesion and expression of extracellular fibronectin, and optical micrograph of mineralised scaffold [adapted from reference Citation41].
![Figure 7. Computer-aided design profile of micro-arc oxidised Ti-6Al-4V alloy cellular structure (also referred as mesh structure) and SEM of micropores grown on the strut surface, bioactive apatite formation, and osteoblast-micropore interaction. Also presented are the fluorescent micrograph showing cell adhesion and expression of extracellular fibronectin, and optical micrograph of mineralised scaffold [adapted from reference Citation41].](/cms/asset/b195f95b-fbad-4551-aaf6-d93602c98e47/ianb_a_2278156_f0007_c.jpg)
Figure 8. Computer-aided design profile of anodised Ti-6Al-4V alloy cellular structure (also referred as mesh structure) and SEM of nanotubes grown on the strut surface, bioactive nanoscale apatite formation, and osteoblast-nanotube interaction. Also presented are the fluorescent micrograph representing cell proliferation and optical micrograph of mineralised scaffold [adapted from reference Citation42].
![Figure 8. Computer-aided design profile of anodised Ti-6Al-4V alloy cellular structure (also referred as mesh structure) and SEM of nanotubes grown on the strut surface, bioactive nanoscale apatite formation, and osteoblast-nanotube interaction. Also presented are the fluorescent micrograph representing cell proliferation and optical micrograph of mineralised scaffold [adapted from reference Citation42].](/cms/asset/674d6860-930e-4d72-8033-fc15a4ba9521/ianb_a_2278156_f0008_c.jpg)
Figure 9. Low and high magnification fluorescence micrographs illustrating the organisation and assessment of actin cytoskeleton (red) and vinculin focal contacts (green) of pre-osteoblasts cultured for 14 days on flat-Ti (control) and cellular Ti-mesh 3D-structures of different porosity (mesh 2 mm: porosity∼55%, mesh 3 mm: porosity∼77%, mesh 4 mm: porosity∼85%). (adapted from reference Citation36).
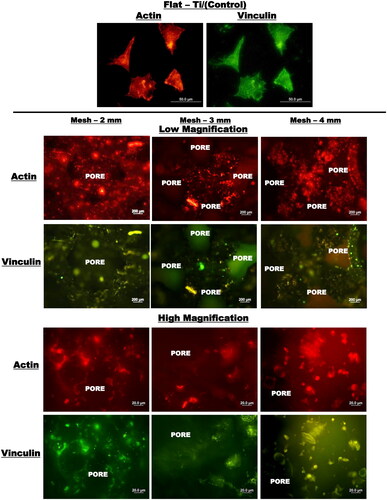
Figure 10. Low and high magnification fluorescence micrographs illustrating the organisation and assessment of actin cytoskeleton (red) and vinculin focal contacts (green) of pre-osteoblasts cultured for 14 days on flat-Ti (control) and cellular Ti-mesh 3D-structures of different porosity (mesh 2 mm: porosity∼55%, mesh 3 mm: porosity∼77%, mesh 4 mm: porosity∼85%) [adapted from reference Citation36].
![Figure 10. Low and high magnification fluorescence micrographs illustrating the organisation and assessment of actin cytoskeleton (red) and vinculin focal contacts (green) of pre-osteoblasts cultured for 14 days on flat-Ti (control) and cellular Ti-mesh 3D-structures of different porosity (mesh 2 mm: porosity∼55%, mesh 3 mm: porosity∼77%, mesh 4 mm: porosity∼85%) [adapted from reference Citation36].](/cms/asset/78081012-f5a9-4edf-98a7-70e8ae62ad06/ianb_a_2278156_f0010_c.jpg)
Figure 11. Low (left) and high (right) magnification optical micrographs of ARS-stained osteoblasts representing mineralisation of ECM on 3D-porous Ti-alloy mesh structure with different porosity (mesh 4 mm: porosity∼85%) after 14 days of incubation. High magnification areas are indicated by dotted squares in the low magnification images. Calcium-rich zones (red colour portion) on the structures represent the mineralised extracellular matrix. Dense mineralised ECM filling the pores on mesh structure of 2 mm and 3 mm indicate higher calcium content, in comparison to other structures [adapted from reference Citation36].
![Figure 11. Low (left) and high (right) magnification optical micrographs of ARS-stained osteoblasts representing mineralisation of ECM on 3D-porous Ti-alloy mesh structure with different porosity (mesh 4 mm: porosity∼85%) after 14 days of incubation. High magnification areas are indicated by dotted squares in the low magnification images. Calcium-rich zones (red colour portion) on the structures represent the mineralised extracellular matrix. Dense mineralised ECM filling the pores on mesh structure of 2 mm and 3 mm indicate higher calcium content, in comparison to other structures [adapted from reference Citation36].](/cms/asset/3cce37da-e4b5-42d7-9856-14a538e0a17a/ianb_a_2278156_f0011_c.jpg)
Figure 12. An example of cellular structure implant of Ti-6Al-4V alloy fabricated by electron beam melting [adapted from reference Citation23].
![Figure 12. An example of cellular structure implant of Ti-6Al-4V alloy fabricated by electron beam melting [adapted from reference Citation23].](/cms/asset/86f17477-1edc-40a6-86fb-30ca8746b1cf/ianb_a_2278156_f0012_c.jpg)
Data availability
Given that it is an overview article, data availability is not relevant. The authors have done their best in citing the relevant articles. However, inadvertently there may be situations where an article has not been appropriately cited. All figures adapted from references and reference number is indicated in the figure captions.