
Figures & data
Figure 1. The absorption spectrum of the (a) chemically synthesized TiO2 nanoparticles and (b) G-TiO2 nanoparticles. The FTIR spectrum of the (c) chemically synthesized TiO2 nanoparticles and (d) G-TiO2 nanoparticles (e) potato peel extract. The zeta potential of the (f) chemically synthesized TiO2 nanoparticles and (g) G-TiO2 nanoparticles. The XRD spectra of (h) chemically synthesized TiO2 nanoparticles and (i) G-TiO2 nanoparticles. The hydrodynamic diameter measured using dynamic light scattering of the (j) chemically synthesized TiO2 nanoparticles and (k) G-TiO2 nanoparticles.
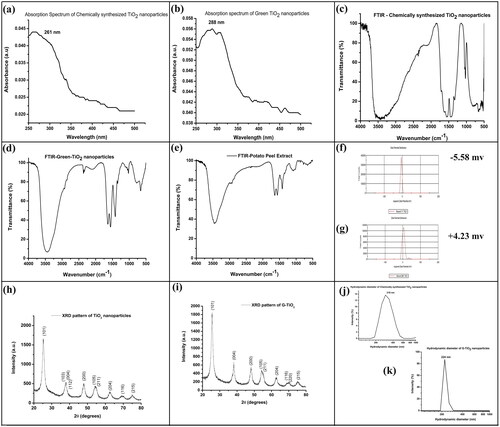
Figure 2. EDAX analysis (a and b) and SEM image (c) of chemically synthesized TiO2 nanoparticles. EDAX analysis (e and f) and SEM image (g) of green synthesized TiO2 nanoparticles. The HR-TEM image of (g) chemically synthesized TiO2 nanoparticles and (h) green synthesized TiO2 nanoparticles.
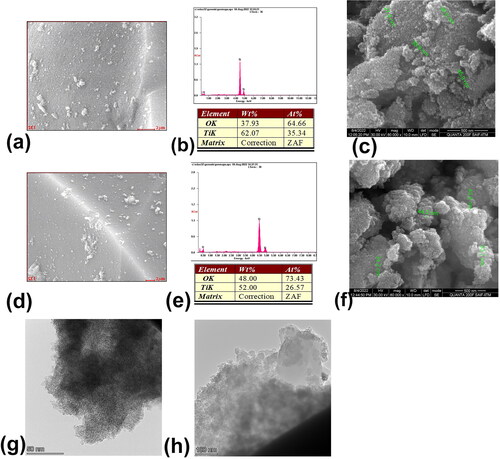
Figure 3. Photocatalytic reduction of the dye bromophenol blue using the synthesized TiO2 nanoparticles using the aqueous extract of Solanum tuberosum (G-TiO2). (a)- the absorption spectrum of only bromophenol blue and the absorption spectrum of bromophenol blue treated with synthesized green titanium dioxide nanoparticles and exposed to sunlight for different times (10, 20, 30, and 40 min). The reduction in absorbance at the absorption maxima of bromophenol blue (590 nm) is shown in the inset. The image of the tubes containing bromophenol blue and G-TiO2 nanoparticles (b) before exposure to sunlight and (c) after exposure to sunlight at different time intervals.
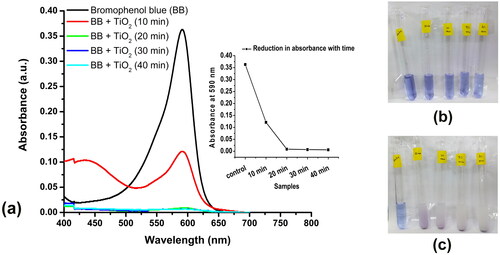
Figure 4. The biocompatibility of the G- TiO2 nanoparticles was monitored using XTT assay in normal cell lines (L132) and cancer cell lines (A549). The synthesized G-TiO2 nanoparticles were treated at different concentrations in these cells and the cell viability was assessed using XTT assay 24 h after exposure. The percentage of cell viability for (a)L132 cells and (b) A549 cells after exposure to different concentrations of G-TiO2 nanoparticles.
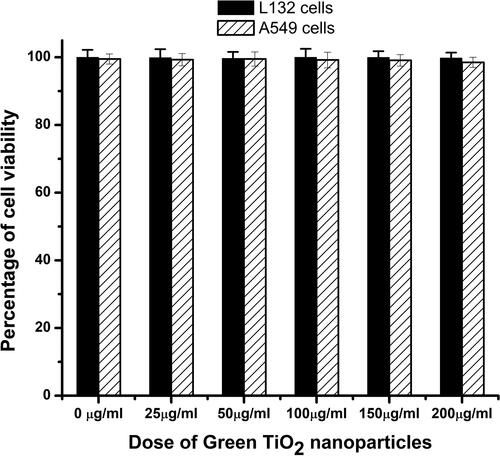
Figure 5. The microscopic images of zebrafish embryos in control, and post-treatment with 50 μg/ml of chemically synthesized TiO2 nanoparticles and G-TiO2 nanoparticles.
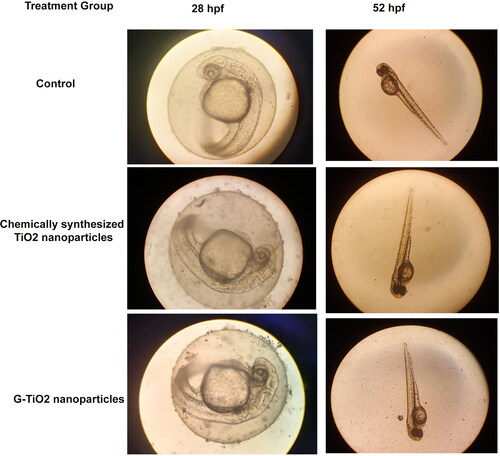
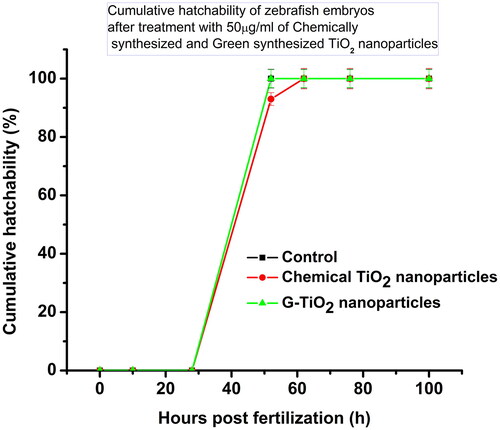
Figure 6. The cumulative hatchability of zebrafish embryos in control, and after treatment with 50 μg/ml of chemically synthesized TiO2 nanoparticles and G-TiO2 nanoparticles.
Supplemental Material
Download MS Word (1.6 MB)Data availability statement
The data that support the findings of this study are available from the corresponding author, [K.G.], upon reasonable request.