
Figures & data
Figure 1. The chemical structure of Cycas thouarsii n-butanol isolated pure compounds.
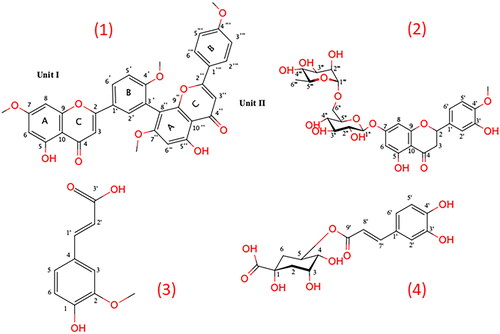
Figure 2. The values of IC50 of the four compounds against oral epithelial cells after treatment for 48 h: A) 7, 4′, 7′′, 4′′′-tetra-O-methylamentoflavone, B) hesperidin, C) ferulic acid, and D) chlorogenic acid.
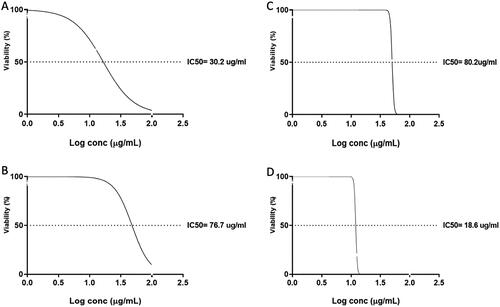
Figure 3. The values of IC50 of the four compounds against MDA-MB-231 cells after treatment for 48 h: A) 7, 4′, 7′′, 4′′′ -tetra-O-methylamentoflavone, B) hesperidin, C) ferulic acid, and D) chlorogenic acid.
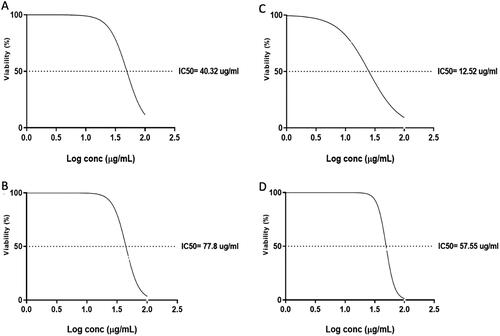
Figure 4. Changes in the morphology of the MDA-MB-231 cells treated with ferulic acid where a represents the untreated cells and B represents the treated cells with ferulic acid. Abbreviation CS denotes cell shrinkage, MB denotes membrane blebbing, and Ab denotes apoptotic bodies.
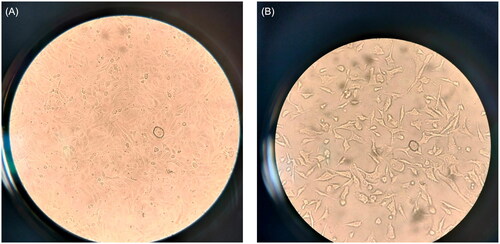
Figure 5. A and C show flow cytometric dot plots. B and D show flow cytometric histograms of the untreated MDA-MB-231 cells.
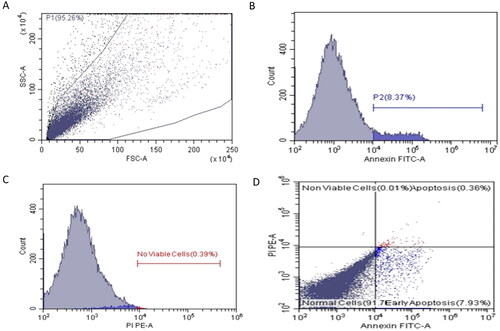
Figure 6. A and C show flow cytometric dot plots. B and D show flow cytometric histograms of compound ferulic acid-treated MDA-MB-231 cells.
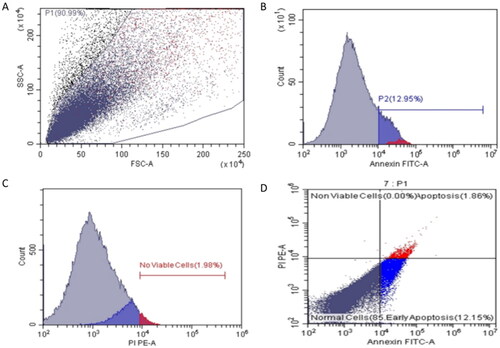
Figure 7. A bar chart showing the percentages of the early and late apoptotic cells in the untreated and treated cells.
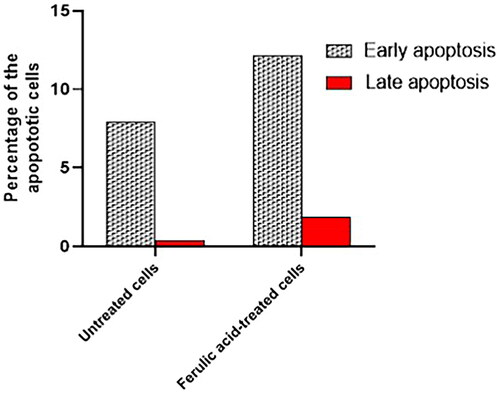
Figure 8. Gel electrophoresis shows fragmentation of the extracted DNA from the treated MDA-MB-231 cells by ferulic acid.
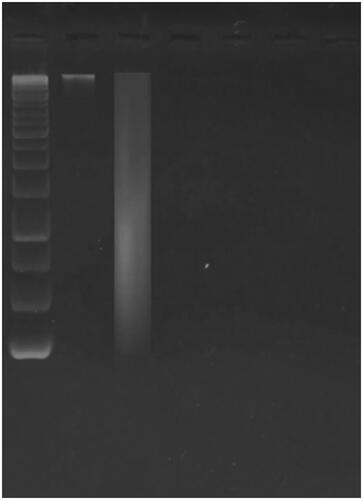
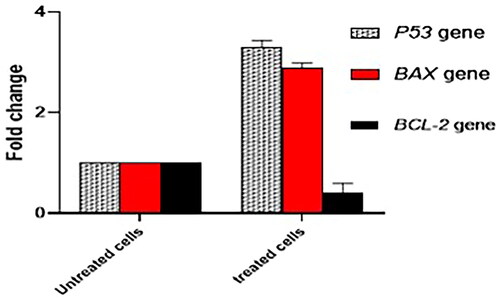
Figure 9. A chart presents the influence of ferulic acid on the relative gene expression of BAX, P53, and BCL-2 genes.
Supplemental Material
Download MS Word (985 KB)Data availability statement
The data are available from the corresponding author upon reasonable request.