
Figures & data
Scheme 1. Schematic illustration of controlled synthesis of FA-Au/PAA-ALA JNPs.
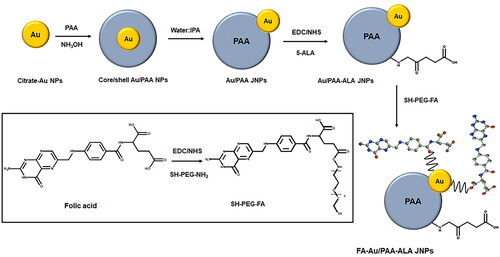
Figure 1. Intercellular localization of the free 5-ALA, passive Au/PAA-ALA, and final active FA-Au/PAA-ALA JNPs in MCF-7 cells under an equivalent concentration of 5-ALA.
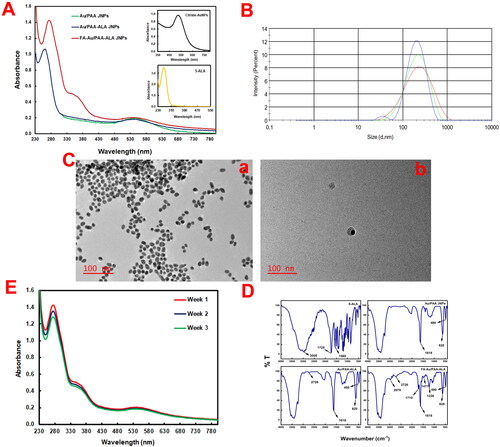
Figure 2. Characterizations of the JNPs. (A) UV/Vis spectra of Au/PAA, Au/PAA-ALA, and FA-Au/PAA-ALA JNPs (insets show UV/Vis spectra of the citrate-Au NPs and 5-ALA), (B) the average hydrodynamic size of FA-Au/PAA-ALA JNPs using DLS, (C) TEM images of (a) citrate-Au NPs and (b) Au/PAA JNPs, (D) FTIR spectra of 5-ALA, Au/PAA, Au/PAA-ALA, and FA-Au/PAA-ALA JNPs, (E) photostability of the final actively targeted FA-Au/PAA-ALA JNPs in PBS over three weeks.
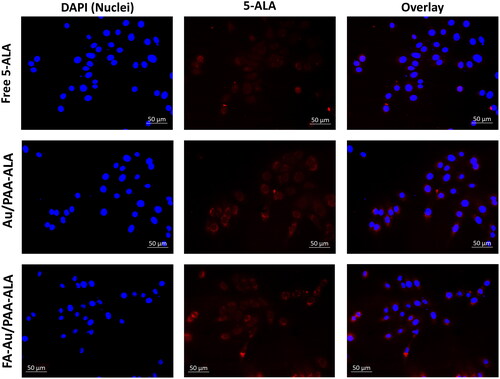
Figure 3. (A) cell morphology changes (B) ATP cell viability assay for the MCF-7 cells treated with either free PS, passive (under IC50 concentration of 5-ALA), or actively targeted JNPs with/without laser irradiation at a wavelength of 636 nm and a fluence of 10 J/cm2.
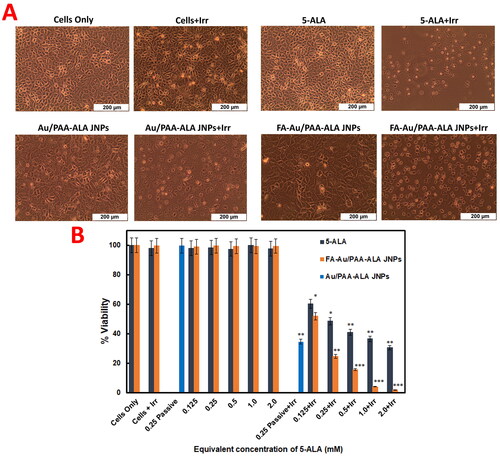
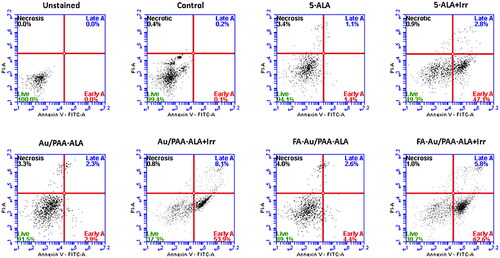
Figure 4. Flow cytometry analysis used Annexin V-FITC/PI staining on treated MCF-7 mediated PDT with the passive and active JNPs under an equivalent 5-ALA (0.25 mM).
Data availability statement
The datasets generated during and/or analysed during the current study are available from the corresponding author upon request.