
Figures & data
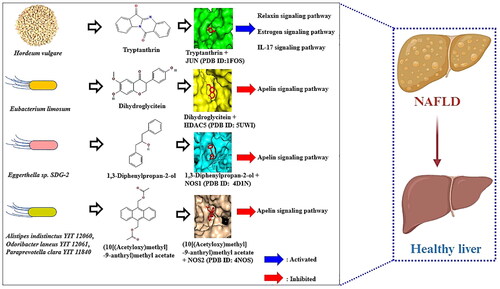
Figure 1. The workflow of this study.
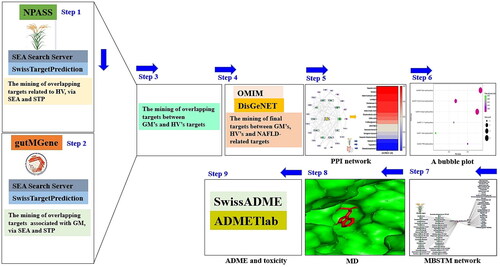
Table 1. The Index of available databases for the study.
Figure 2. (a) The 79 overlapping targets associated with SMs from HV between SEA and STP. (b) The 668 overlapping targets related to SMs from GM between SEA and STP. (c) The number of 66 intersecting targets associated with SMs between 79 targets from (A) and 668 targets from (B). (d) The identification of 31 crux targets between 66 targets from (C) and NAFLD (1836 targets).
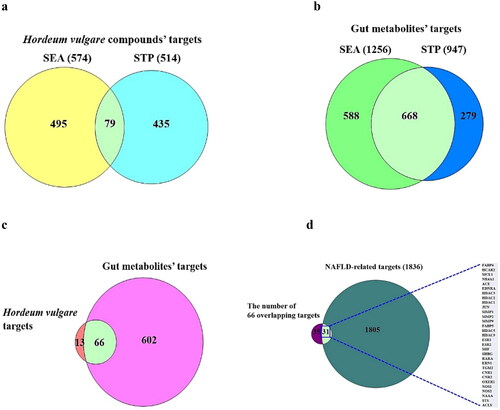
Table 2. The number 24 secondary metabolites of HV from NPASS database.
Figure 3. (a) PPI networks (30 nodes and 74 edges). (b) A heatmap of binding energy of SMs on JUN (PDB ID: 1FOS). (c) The molecular conformation on tryptanthrin (PubChem ID: 73549) – JUN (PDB ID: 1FOS) complex. (d) Bubble diagram of 6 signalling pathways associated with occurrence and progression of NAFLD.
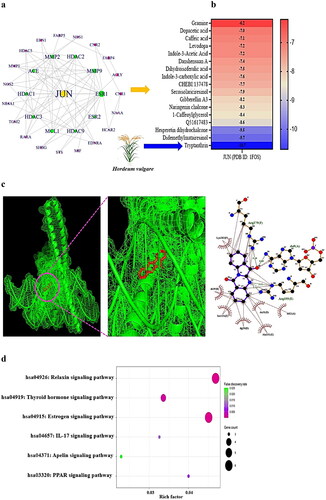
Figure 4. GBSTM networks (83 nodes and 93 edges). Green circle: GM; red circle: the Apelin signalling pathway; orange circle: targets; and sky blue circle: SMs.
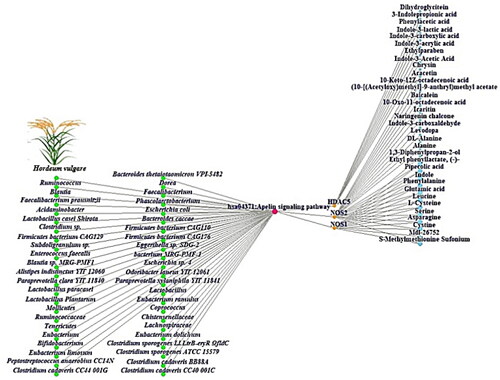
Figure 5. (a) The molecular conformation on dihydroglycitein (PubChem ID: 101101166) – HDAC5 (PDB ID: 5UWI). (b) The molecular conformation on 1,3-diphenylpropan-2-ol (PubChem ID: 138478) – NOS1 (PDB ID: 4D1N). (c) The molecular conformation on (10[(acetyloxy)methyl]-9-anthryl)methyl acetate (PubChem ID: 613145) -NOS2 (PDB ID: 4NOS).
![Figure 5. (a) The molecular conformation on dihydroglycitein (PubChem ID: 101101166) – HDAC5 (PDB ID: 5UWI). (b) The molecular conformation on 1,3-diphenylpropan-2-ol (PubChem ID: 138478) – NOS1 (PDB ID: 4D1N). (c) The molecular conformation on (10[(acetyloxy)methyl]-9-anthryl)methyl acetate (PubChem ID: 613145) -NOS2 (PDB ID: 4NOS).](/cms/asset/6fc39d92-703b-4465-a15f-3009b641dfb0/ianb_a_2347380_f0005_c.jpg)
Figure 6. The chemical structures of four key SMs against NAFLD in the study. (a) tryptanthrin. (b) dihydroglycitein. (c) 1,3-diphenylpropan-2-ol. (d) (10[(acetyloxy)methyl]-9-anthryl)methyl acetate.
![Figure 6. The chemical structures of four key SMs against NAFLD in the study. (a) tryptanthrin. (b) dihydroglycitein. (c) 1,3-diphenylpropan-2-ol. (d) (10[(acetyloxy)methyl]-9-anthryl)methyl acetate.](/cms/asset/95dd3644-8a7e-40e3-8001-17c371b3f5d0/ianb_a_2347380_f0006_c.jpg)
Supplemental Material
Download MS Excel (10.2 KB)Supplemental Material
Download MS Excel (17.1 KB)Supplemental Material
Download MS Excel (10.6 KB)Supplemental Material
Download MS Excel (11.8 KB)Supplemental Material
Download MS Excel (11 KB)Supplemental Material
Download MS Excel (68.7 KB)Data availability statement
The authors confirm that the data supporting the findings of this study are available within the article and its supplementary materials.