
Figures & data
Figure 1. House of quality for sustainability.
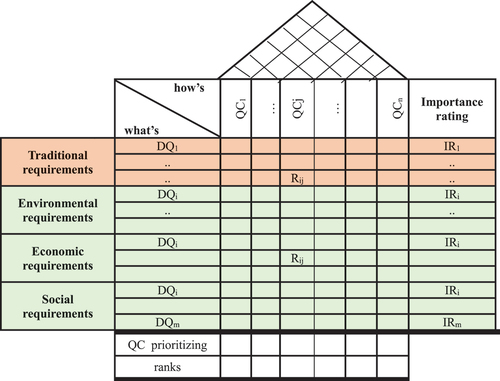
Figure 2. Dynamic QFD model.

Figure 3. Dynamic QFDS model.
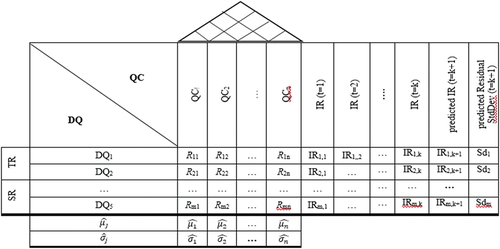
Figure 4. The structure of the dynamic QFD methodology.
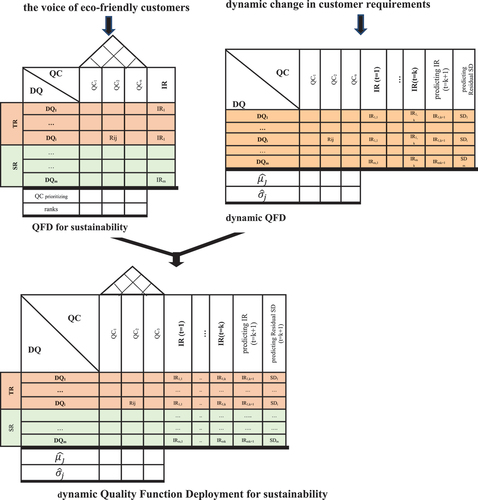
Figure 5. HOQS for the Chinese tablets.
Table 1. The sample of the five cities
Table 2. Actual, fitted, predicted, and fitting error values of all IR
Figure 6. The predicted IR values for the year of 2018.
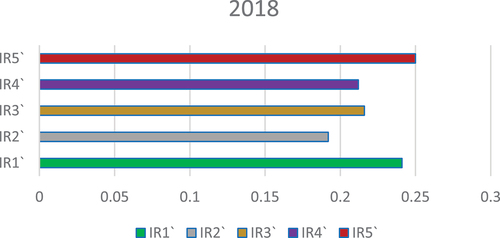
Figure 7. The actual, and predicted IR values.
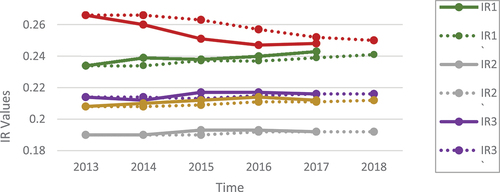
Figure 8. Dynamic QFD for Chinese tablets.
Note: to normalize the values of the correlation matrix as mentioned previously, formula (2) will be used.
Table 3. The statistical tests for DQs