
Figures & data
Table 1. Review of lot sizing approaches.
Table 2. Overview of data case company.
Table 3. Overview of interviews outside the case company.
Figure 1. Mapping of design requirements (DRs) and design principles (DPs).
Table 4. Design requirements from OM and DSS.
Figure 2. Solution approach.
Figure 3. Decision support system with discrete event simulation model of production process.
Table 5. Lot sizing strategies performance in the case company.
Table 6. Product basic data and lot sizes for strategies 1.3 and EOQ.
Figure 4. Example of KPIs displayed in the simulation model.
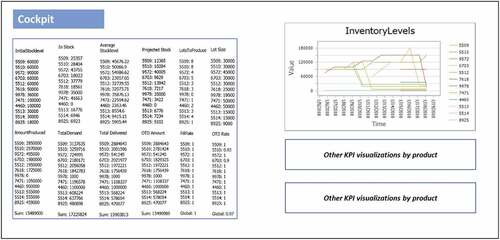
Figure 5. Theoretical implications.
Data availability statement
Due to the nature of this research, participants of this study did not agree for their data to be shared publicly, so supporting data is not available.
