Figures & data
Figure 1. Collaboration with the VR learning environment.
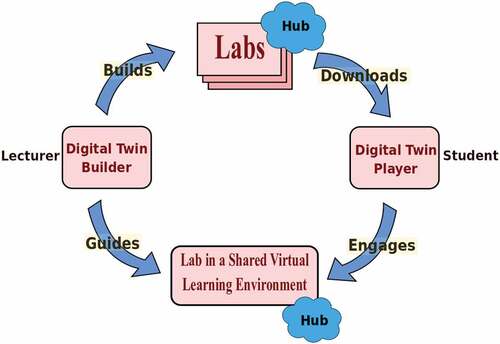
Figure 2. Digital twin builder architecture.
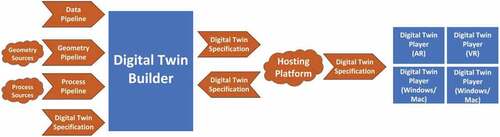
Table 1. Digital twin platform datasources.
Figure 3. Digital twin data pipeline.
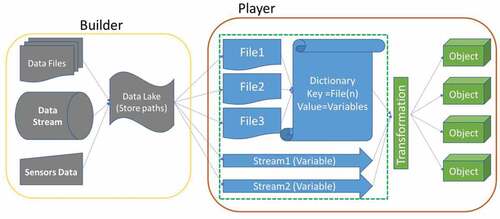
Figure 4. Overall architecture of the geometry pipeline. The ‘Reduce’ steps highlighted are expanded upon in .
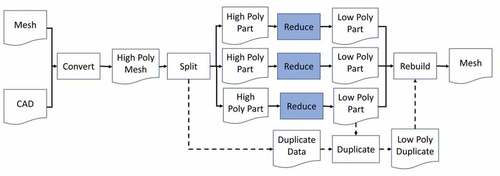
Figure 5. Geometry pipeline ‘reduce’ step. Copies of this process are run in parallel for every unique part in the model. The three components highlighted in blue are the three machine learning models.
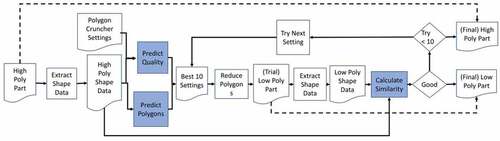
Table 2. Shape and similarity metrics used in the geometry pipeline to ensure mesh visual quality. Note that none of these metrics encode the scale of the object, to ensure the method is scale invariant.
Figure 6. Mesh quality training data collection application (original on the left, processed on the right).
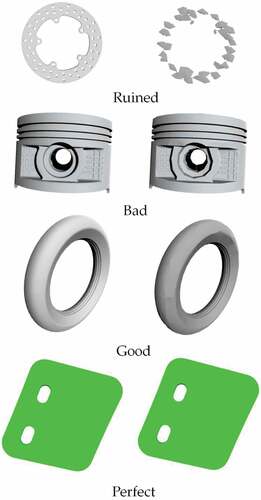
Figure 7. Example model produced with the geometry pipeline. The casing has been rendered transparent to show the internal details.
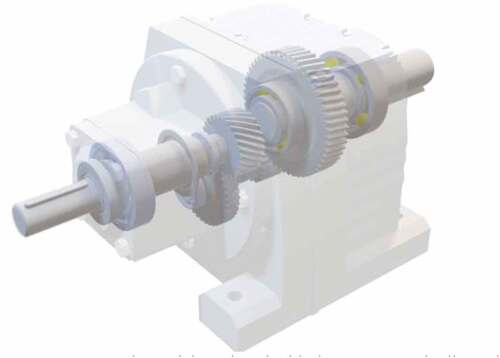
Figure 8. Overview of process pipeline model.
Figure 9. Hierarchy of an FBX file.
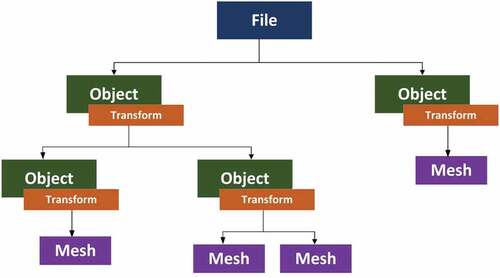
Figure 10. Modified FBX hierarchy used within the scenario definition.
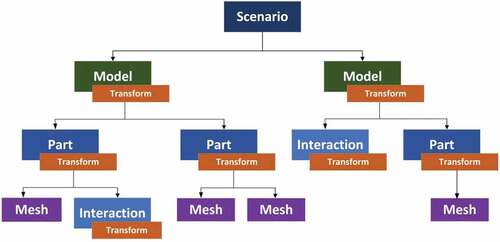
Figure 11. The scenario definition file link between the digital twin builder and player.
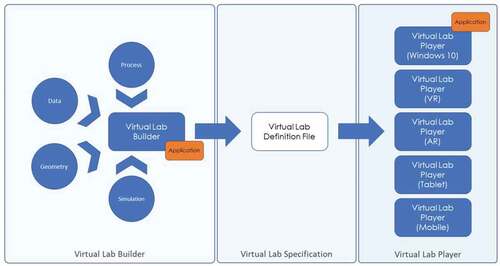
Figure 12. The case study brief.
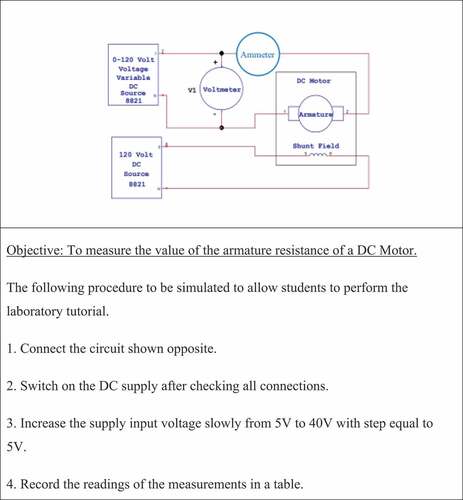
Figure 13. Specifying the case study within the digital twin builder.
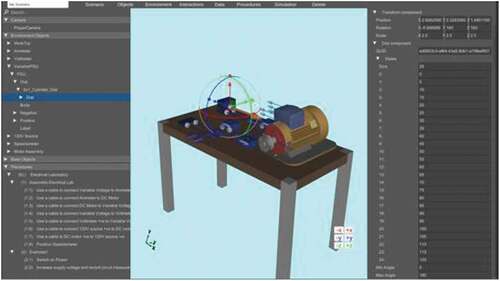
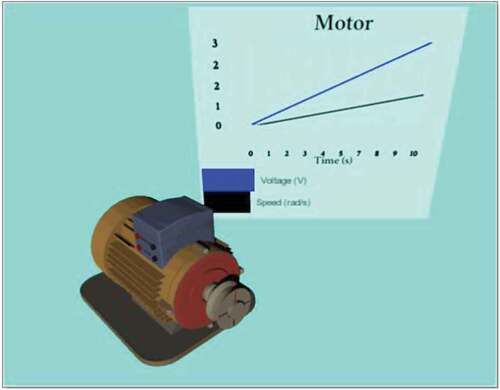
Figure 14. The electrical laboratory within the digital twin player.
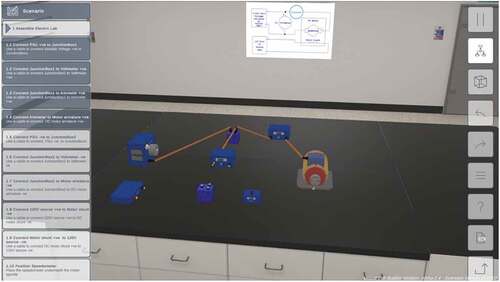
Figure 15. The digital twin player showing an equipment item together with its data simulation results.