
Figures & data
Figure 1. A sample of AS signal is decomposed by EEMD and EMD: (a) original signal, (b) using EEMD and (c) using EMD.
Figure 2. Flowchart of predicting surface roughness via EEMD-IMPE-PSO-LS-SVR method.
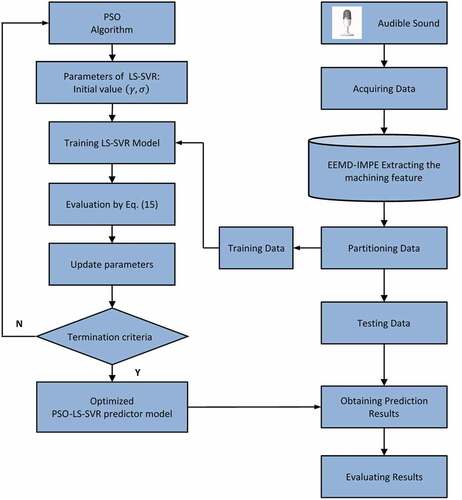
Figure 3. Diagram of the experimental setup, a) experimental setup, b) grinding wheel.
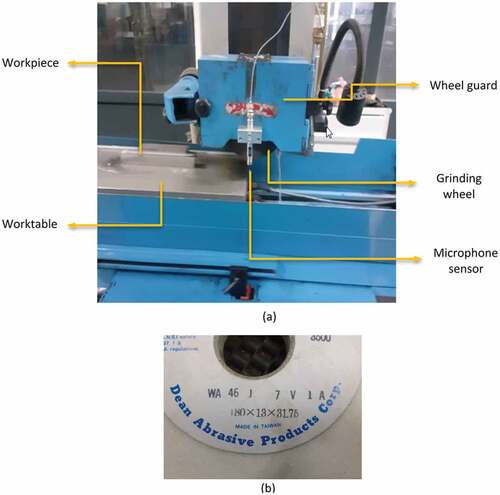
Figure 4. Diagram of the measurement.
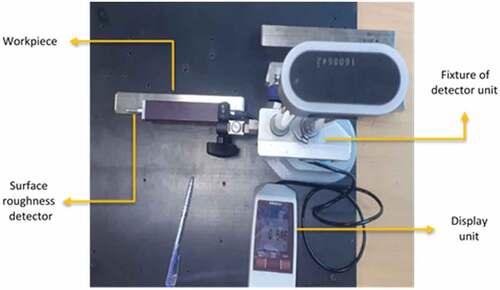
Figure 5. Scatter diagram of the training data.
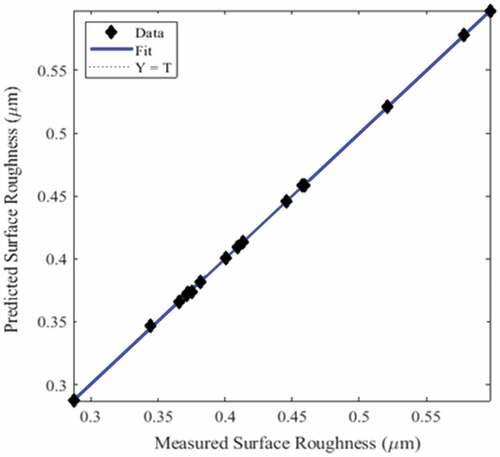
Table 1. Surface roughness prediction results of training data.
Table 2. Surface roughness prediction results of testing data.
Figure 6. Comparison between prediction values and experimental value of test data.
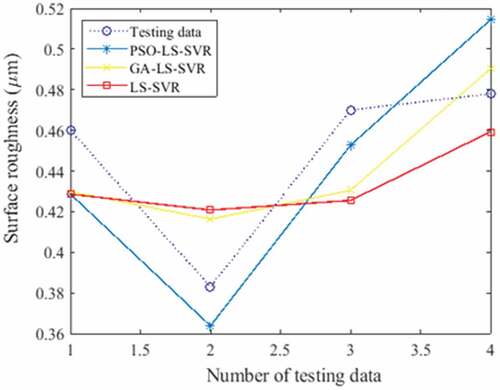
Table 3. Comparison of prediction accuracy between different predictor model.
Figure 7. Comparison diagram of the prediction accuracy (a) training data, (b) testing data.
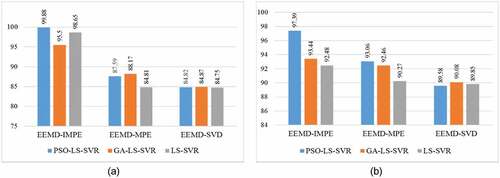
Table 4. Comparison of prediction accuracy between different extracted feature sets.
