Figures & data
Figure 1. Number of publications in the resulting sample for each step of the study.
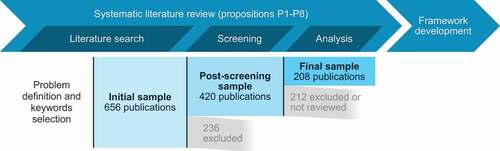
Table 1. List of keywords, their combination using Boolean and proximity operators.
Table 2. Categories of labels and questions used for the screening and subsequent analysis.
Figure 2. Publication year of the articles in the initial sample collected and final sample reviewed.
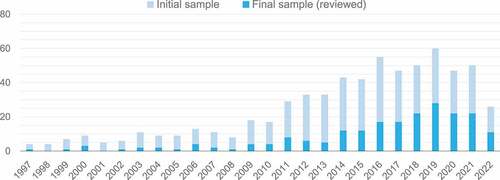
Figure 3. Geographical distribution of the articles in the initial sample per continent and number of articles reviewed for the final sample.
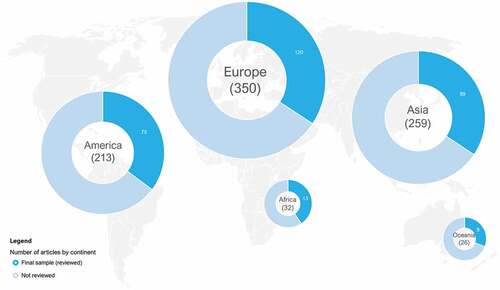
Figure 4. Subject areas of articles in the initial sample collected and final sample reviewed.
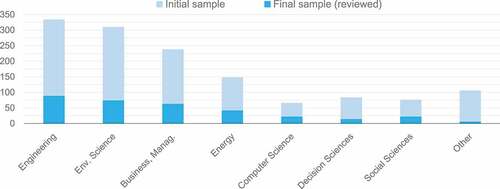
Figure 5. Sources of articles in the initial sample collected and final sample reviewed.
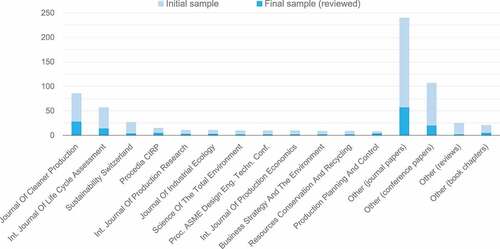
Figure 6. Distribution of methods against type of measure, unit of analysis, scope and sustainability dimensions.
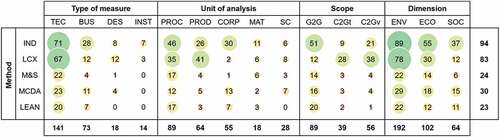
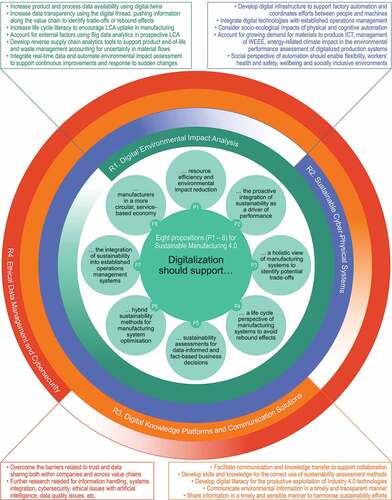
Figure 7. Proposed research framework for Digitalized Sustainable Manufacturing: four research themes (R1–4) and eight propositions (P1–8) to align digitalization and sustainability goals.