
Figures & data
Figure 1. Keywords and search string generation.
Figure 2. Protocol of the systematic literature search.
Figure 3. Division of the publications sorted by year.
Table 1. Summary of different positioning determination methods (Kim Geok et al., Citation2021).
Figure 4. Triangulation using TOA (Zekavat & Buehrer, Citation2019).
Figure 5. Calculation of RTT (Al-Kadi & Zorn, Citation2020).
Figure 6. Position determination using TDOA.
Figure 7. Position determination using AOA.
Table 2. Summary of radio-based technologies for indoor positioning (Kim Geok et al., Citation2021).
Table 3. Positioning performance requirements (3GPP, Citation2021b).
Table 4. Use case specifications (3GPP, Citation2021a).
Figure 8. Requirement overview of the IMT-2020.
Figure 9. Overview of 3GPP time planning according to (3GPP, Citation2020a).
Table 5. Performance requirements for horizontal and vertical positioning service levels (3GPP, Citation2021c).
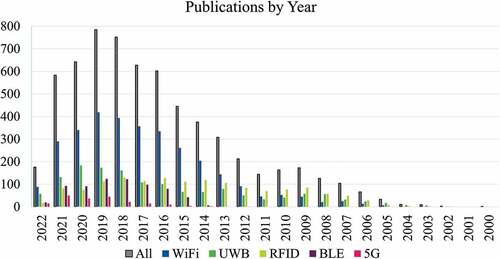
Figure A1. Publications by year and positioning technology
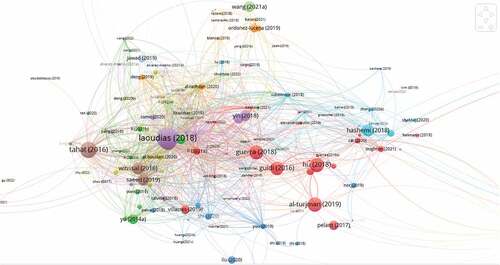
Bibliometric structure of 5G positioning for industry and indoor
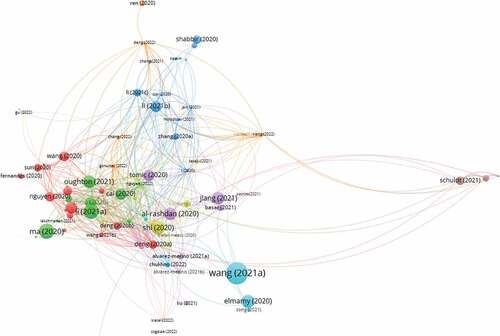
Bibliometric structure of 5G positioning for industry and indoor since 2019
Acronym Table
Data Availability Statement
Due to the nature of a literature review, no data was generated, collected, or used for the analysis of this publication. All references can be found below. Therefore, no data exists that can be made public.