
Figures & data
Table 1. Summary of the keywords searched and total articles found in different search platforms.
Table 2. Comparative table showing the methods and results of the most relevant papers found.
Figure 1. The cell structure of a Gated Recurrent Unit. (Mateus et al., Citation2021).
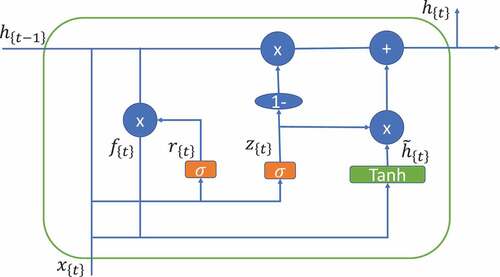
Figure 2. Diagram showing the flow the process data, from the press’ sensors to predictions.
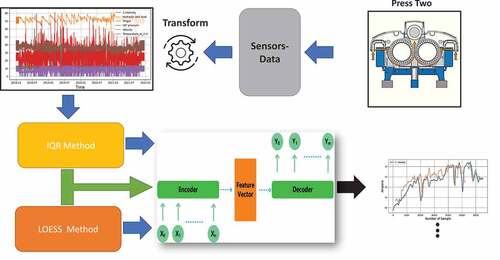
Figure 3. Plot of the variables for press number 4, before any data pre-processing. The variables contain a large amount of noise.
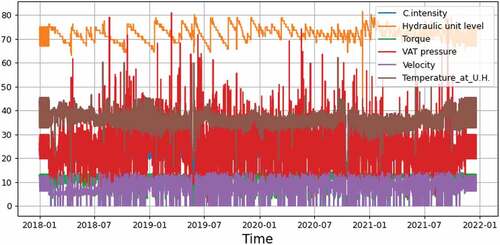
Figure 4. Plot of the variables for press number 4, after data pre-processing. The variables contain a low amount of noise.
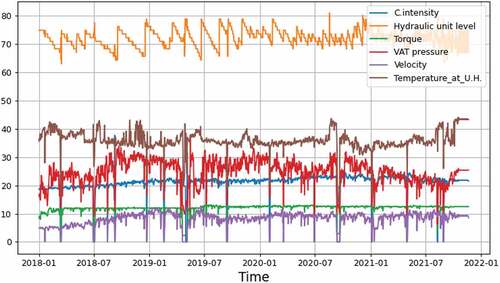
Figure 5. Variable autocorrelations, before cleaning and filtering the data.
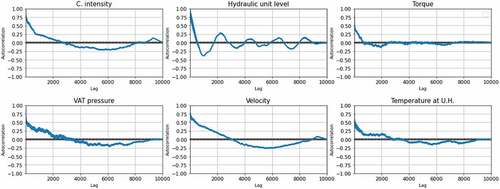
Figure 6. Autocorrelation for the all variables, obtained after cleaning and smoothing the data using LOWESS with 36 days window.
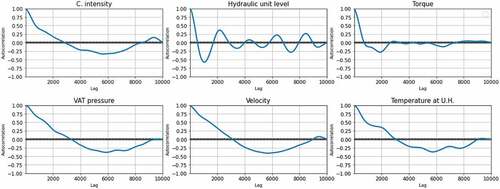
Figure 7. RMSE of the best models for press 2, using the two different methods for pre-processing data, for the smaller and larger GRU networks. Method 1 only removes discrepant data. Method 2 smoothes the data using a LOWESS filter. Method (1,2) is the application of both. (a) prediction test with 50 GRU units with the two data processing methods, (b) prediction test with 500 GRU units with the two data processing methods.
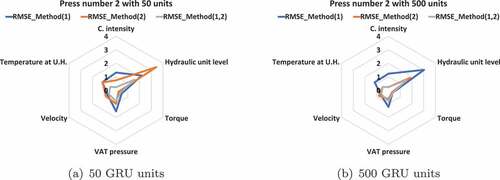
Figure 8. RMSE for predictions of press 4 using the different data pre-processing methods. LOWESS filtering and 500 GRU units result in smaller RMSE errors. (a) prediction test with 50 GRU units with the two data processing methods, (b) prediction test with 500 GRU units with the two data processing methods.
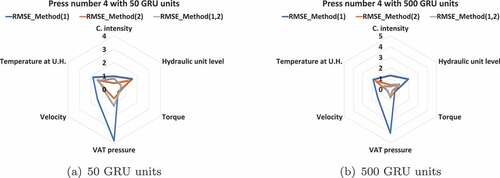
Figure 9. Signals and forecast results for press 2, with 30 day advance, using the two data processing methods, both removal of discrepant data and data smoothing using LOWESS filtering with 36 days window. The blue lines represent the actual value. The Orange and green lines are predictions, respectively, in the train and test subsets.
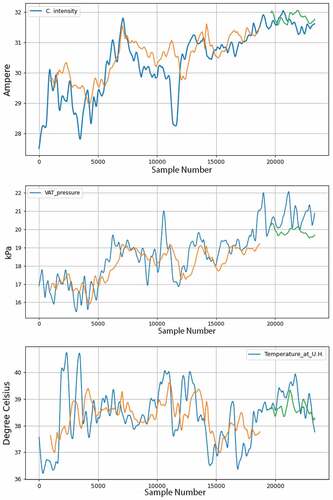
Table 3. Prediction error results for 30 days advance forecast, using the two data preprocessing methods, removal of discrepant data and smoothing (LOWESS 36 days), for the 500 unit GRU with 5 days window, for press 2.
Figure 10. Signals and forecast results for press 4, with 30 day advance, using the two data processing methods, both removal of discrepant data and data smoothing using LOWESS filtering with 36 days window. The blue lines represent the actual value. The Orange and green lines are predictions, respectively, in the train and test subsets.
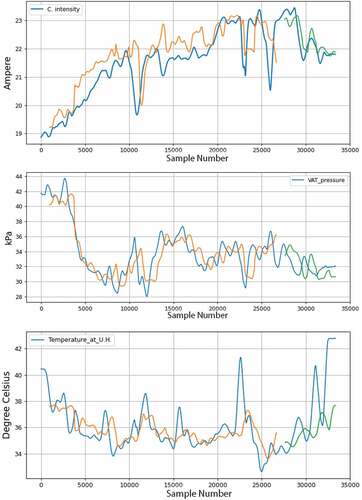
Table 4. Prediction error results for 30 days advance forecast, using the two data preprocessing methods, removal of discrepant data and smoothing (LOWESS 36 days), for the 500 unit GRU with 5 days window, for press 4.