Figures & data
Table 1. Terminology characterising Nodes and Arcs.
Figure 1. Histogram of the co-occurrence values divided by component in focus. The trend line highlights a cut-off point in correspondence with value 3.
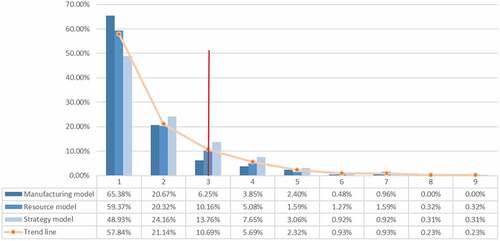
Figure 2. Zoom-in on the distribution of the co-occurrence values from 3 (the cut-off point).
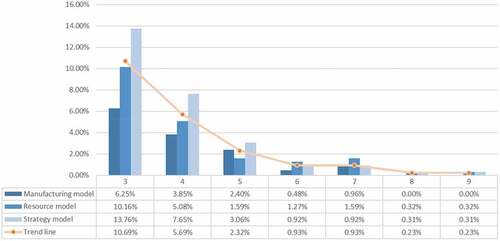
Figure 3. Keywords map extracted from VOSviewer. The map includes 2312 nodes. The larger the nodes, the higher the occurrence value. The colour indicates the cluster to which the node belongs. The arcs indicate whether two keywords co-occur.
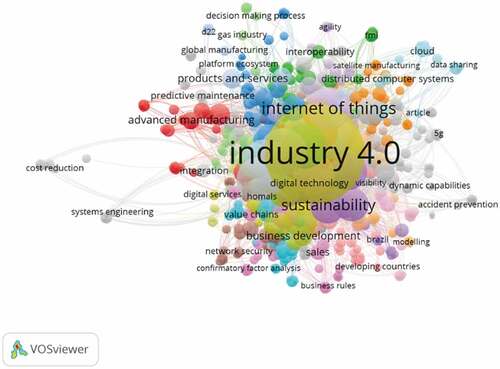
Figure 4. Reduced keywords map as a result of the screening of the nodes step. The map includes 90 nodes with a minimum occurrence value of 6.
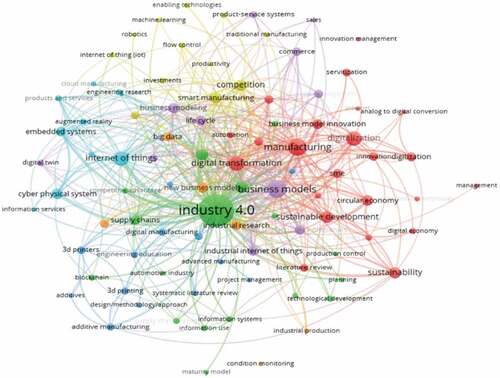
Table 2. List of the 90 keywords. The grey rows are the keywords associated with IBM´s components. The remaining rows are not considered in this analysis.
Table 3. Characterisation of Strategy model, Resource model, and Network model. The number of keywords associated with each component is specified at the bottom of the table. BM framework adopted from (Wirtz et al., Citation2016).
Table 4. Characterisation of Customer model, Market offer model, and Revenue model. The number of keywords associated with each component is specified at the bottom of the table. BM framework adopted from (Wirtz et al., Citation2016).
Table 5. Characterisation of Manufacturing model, Procurement model, and Financial model. The number of keywords associated with each component is specified at the bottom of the table. BM framework adopted from (Wirtz et al., Citation2016).
Figure 5. Matrix representing the connections identified between MAnufacturing Model and Resources Model. The bottom part summarises the total number of filled cells for each component pair and the number of weak and strong co-occurrence values.
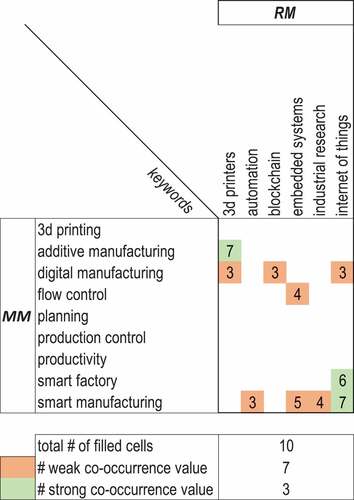
Figure 6. Matrix representing the connections identified between MAnufacturing Model and Strategy Model. The bottom part summarises the total number of filled cells for each component pair and the number of weak and strong co-occurrence values.
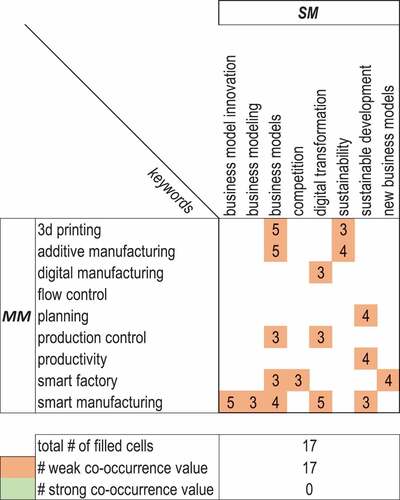
Figure 7. Matrix representing the connections identified between Manufacturing Model and Network Model. The bottom part summarises the total number of filled cells for each component pair and the number of weak and strong co-occurrence values.
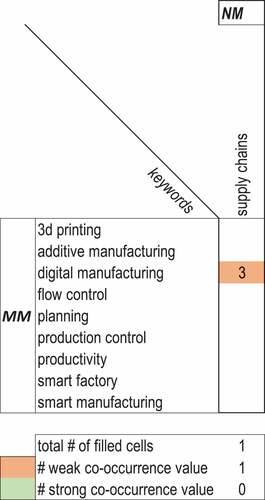
Figure 8. Matrix representing the connections identified between Manufacturing Model and Market Offer Model. The bottom part summarises the total number of filled cells for each component pair and the number of weak and strong co-occurrence values.
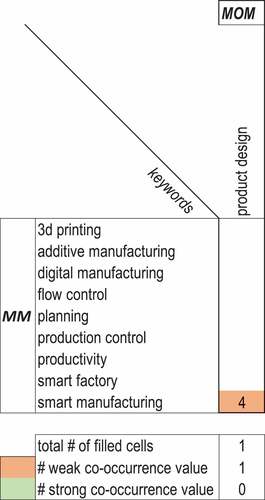
Figure 9. Matrix representing the connections identified between Strategy Model and Resource Model. The bottom part summarises the total number of filled cells for each component pair and the number of weak and strong co-occurrence values.
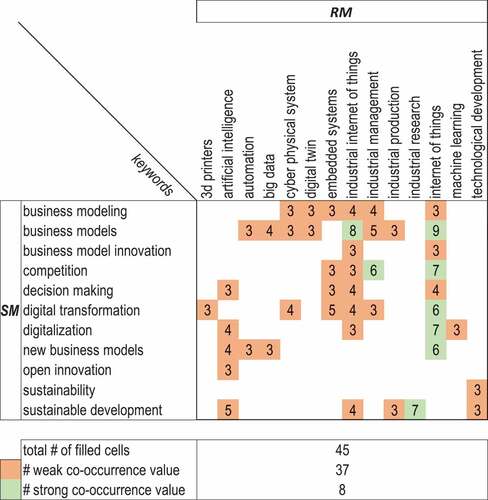
Figure 10. Matrix representing the connections identified between Strategy Model and Network Model. The bottom part summarises the total number of filled cells for each component pair and the number of weak and strong co-occurrence values.
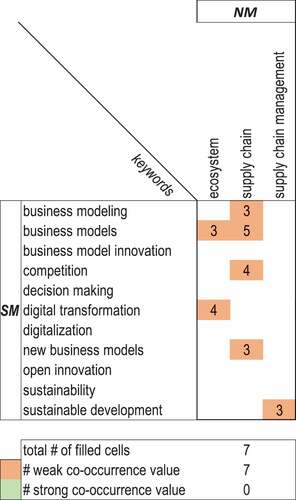
Figure 11. Matrix representing the connections identified between Strategy Model and Market Offer Model. The bottom part summarises the total number of filled cells for each component pair and the number of weak and strong co-occurrence values.
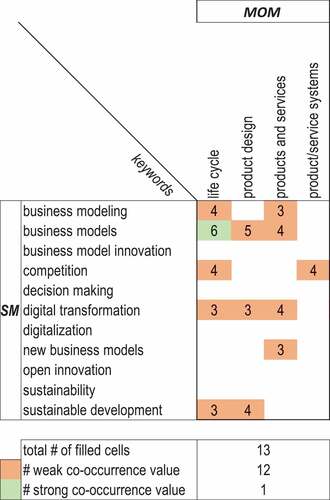
Figure 12. Matrix representing the connections identified between Strategy Model and Procurement Model. The bottom part summarises the total number of filled cells for each component pair and the number of weak and strong co-occurrence values.
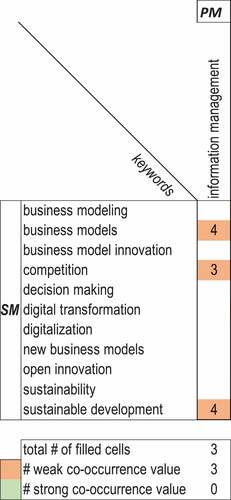
Figure 13. Matrix representing the connections identified between Strategy Model and Financial Model. The bottom part summarises the total number of filled cells for each component pair and the number of weak and strong co-occurrence values.
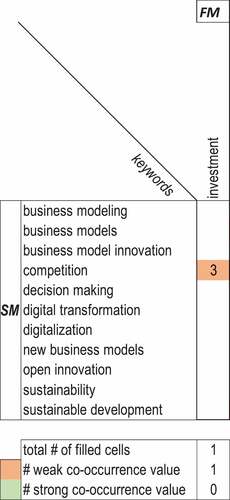
Figure 14. Matrix representing the connections identified between Strategy Model and Revenue Model. The bottom part summarises the total number of filled cells for each component pair and the number of weak and strong co-occurrence values.
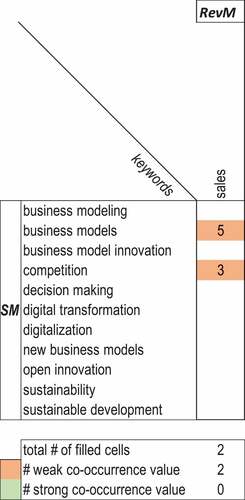
Figure 15. Matrix representing the connections identified between Resource Model and Market Offer Model. The bottom part summarises the total number of filled cells for each sub-model pair and the number of weak and strong co-occurrence values.
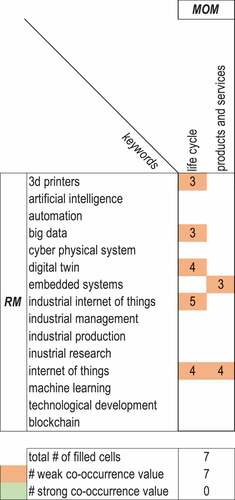
Figure 16. Matrix representing the connections identified between Revenue Model and Network Model. The bottom part summarises the total number of filled cells for each sub-model pair and the number of weak and strong co-occurrence values.
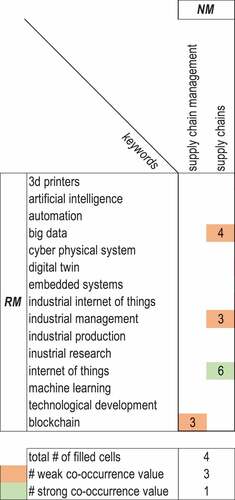
Figure 17. Matrix representing the connections identified between Revenue Model and Procurement Model. The bottom part summarises the total number of filled cells for each sub-model pair and the number of weak and strong co-occurrence values.
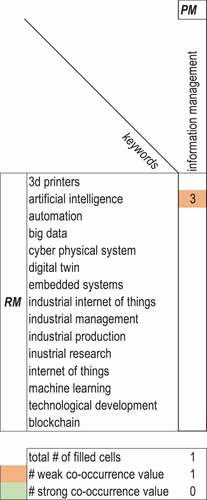
Figure 18. Matrix representing the connections identified between Revenue Model and Financial Model. The bottom part summarises the total number of filled cells for each sub-model pair and the number of weak and strong co-occurrence values.
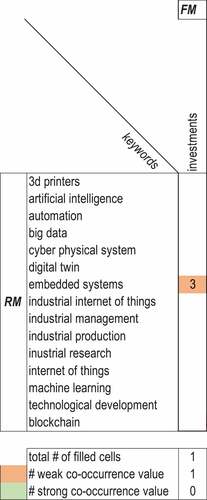
Figure 19. Star diagram identifying the connections for MM. The lines show the link among the components. The thickness of the lines represents the number of weak and strong co-occurrence values. The lines are orange for the weak values and green for the strong ones. The circles are coloured according to the predominant values, i.e. weak links.
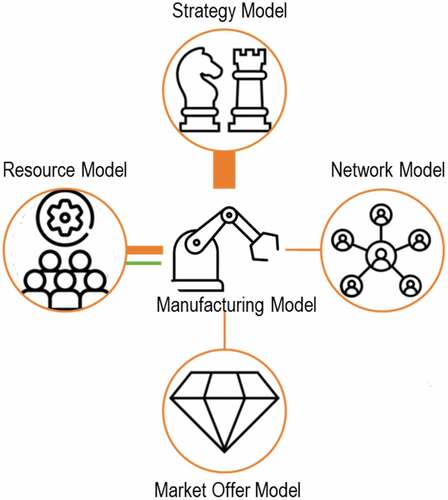
Figure 20. Star diagram identifying the connections for RM. The lines show the link among the components. The thickness of the lines represents the number of weak and strong co-occurrence values. The lines are orange for the weak values and green for the strong ones. The circles are coloured according to the predominant values, i.e. weak links.
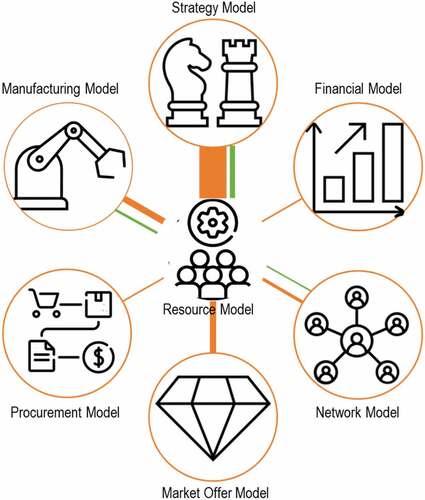
Figure 21. Star diagram identifying the connections for SM. The lines show the link among the components. The thickness of the lines represents the number of weak and strong co-occurrence values. The lines are orange for the weak values and green for the strong ones. The circles are coloured according to the predominant values, i.e. weak links.
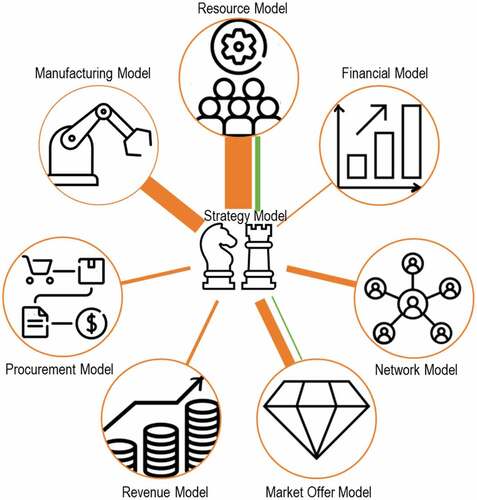
Figure A1. Matrix representing the connections identified between Manufacturing Model and Resources Model, Strategy Model, Market Offer Model and Network Model. The bottom part summarises the total number of filled cells for each sub-model pairs, the number of weak and strong co-occurrence value.
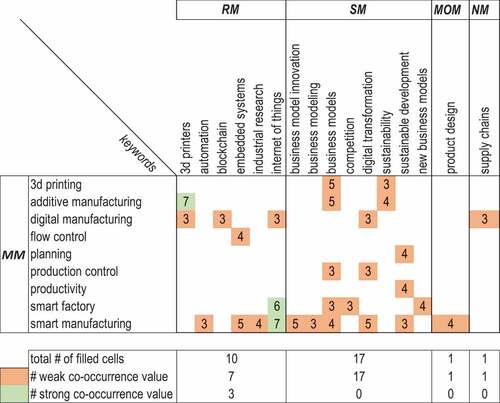
Figure B1. Matrix representing the connections identified between Resources Model and Manufacturing Model, Strategy Model, Financial Model, Market Offer Model, Network Model and Procurement Model. The bottom part summarises the total number of filled cells for each sub-model pairs, the number of weak and strong co-occurrence value.
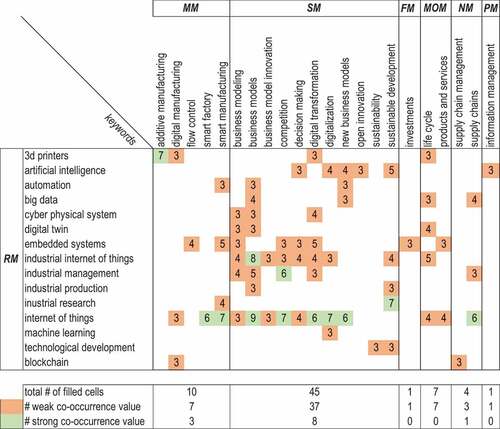
Figure C1. Matrix representing the connections identified between Strategy Model and Resources Model, Manufacturing Model, Financial Model, Market Offer Model, Revenue Model, Network Model and Procurement Model. The bottom part summarises the total number of filled cells for each sub-model pairs, the number of weak and strong co-occurrence value.
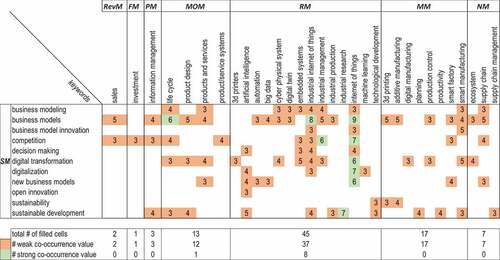
Figure D1. Distribution of documents by year. The extraction was made July the 17th 2021.
Figure D2. Distribution of documents by type.
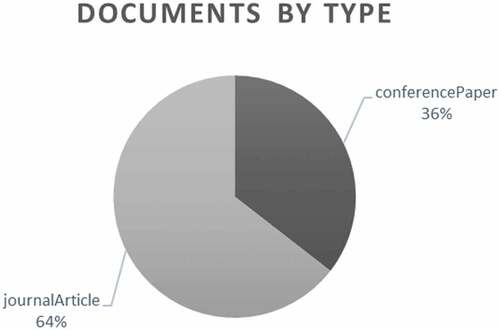
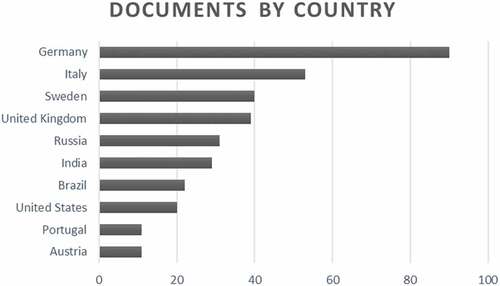
Figure D3. Distribution of documents by country. The chart include the first 10 countiries.