
Figures & data
Figure 1. Tree of supply chain resilience, adapted from (Melnyk et al., Citation2014).
Resilience, its two categories Rsistence and Recovery and thier two subsequent categories.
Figure 2. Literature review process – funnel approach.
Illustration of the literature funnel approach adopted in the research.
Table 1. SCR definitions by authors from 2000 to 2022.
Figure 3. Bar plot of frequent words in the supply chain resilience (SCR) definitions of articles published from 2000 to 2022.
Supply Chain Resilience definitions of articles published in the last two decades.
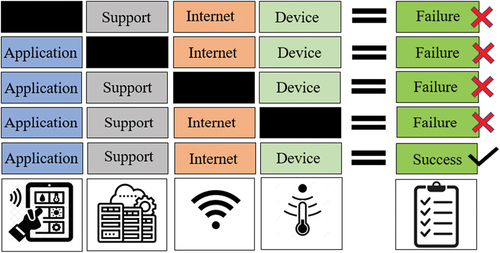
Figure 4. Four-layer architecture of IoT critical eco-system (adapted from Sharma et al., Citation2020).
The importance of the comprehensive IoT layers effectivnes to ensure full ecosystem reliability.
Data availability statement
The data of this study are available from the corresponding author upon request.