
Figures & data
Figure 1. Methodology for the analysis of field service maintenance reports.
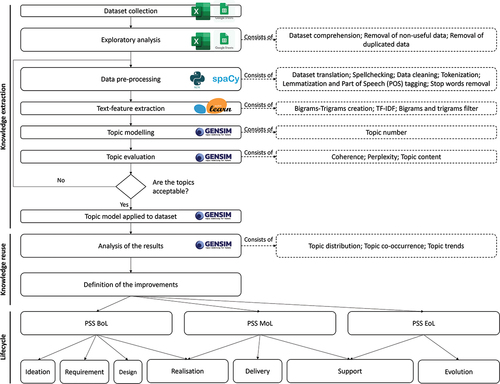
Table 1. Pseudocode for analysis.
Figure 2. Distribution of interventions per technician.
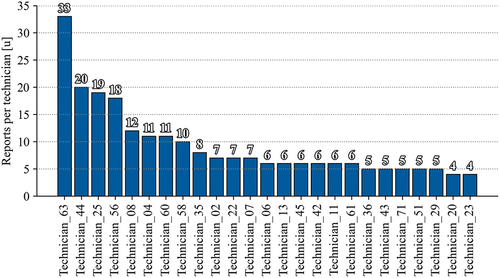
Figure 3. Number of reports filled per year by the top six technicians.
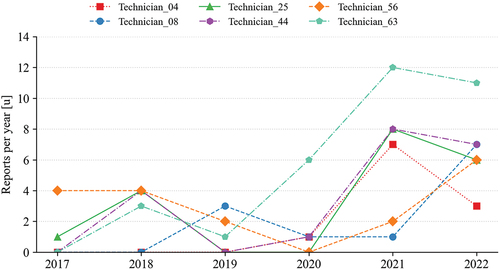
Figure 4. Distribution of interventions per a) nation, b) technician, and c) year.
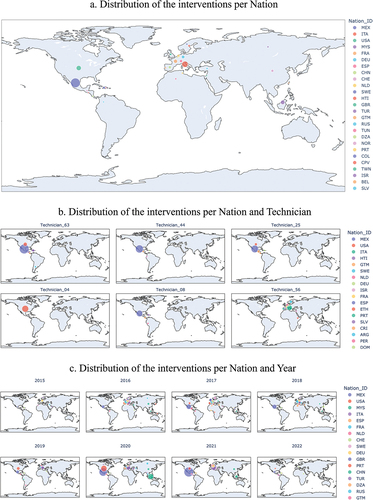
Figure 5. Topics occurrences in the dataset.
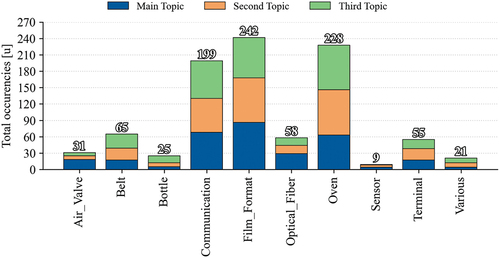
Figure 6. Topic trends over the years. The bigger the marker, the higher the number of interventions.
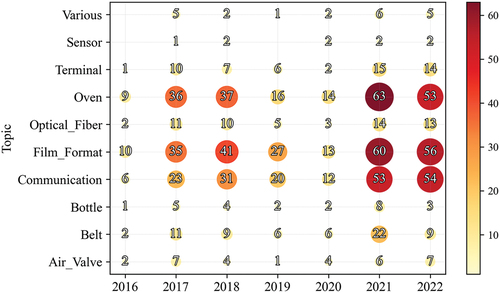
Figure 7. Topic co-occurrence.
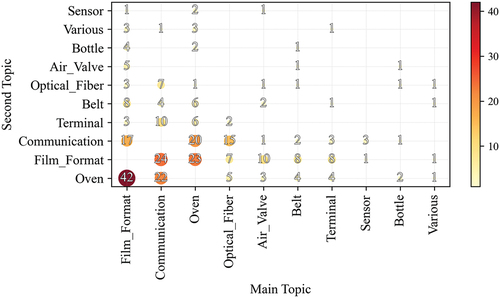
Figure 8. a) co-occurrence between topic and technician and b) distribution of topics among the four models with more interventions.
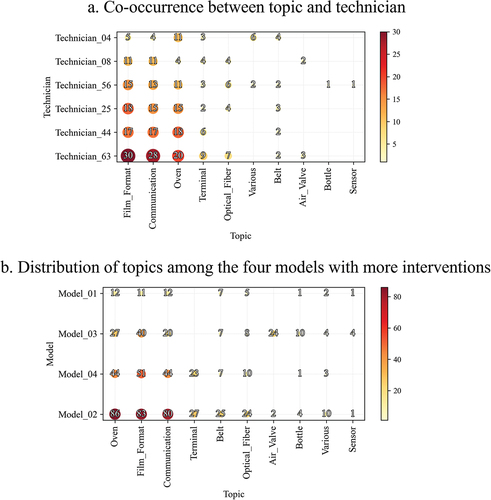
Table 2. Topic content.
Table 4. Additional general improvements achievable through field data analysis.
Table 3. Improvements were achieved following the NLP analysis for the case of company A.