Figures & data
Figure 1. (a) distribution of industrial AR applications per industrial segments (b) distribution of the industrial applicability of the primary industrial AR studies (de Souza Cardoso et al., Citation2020).
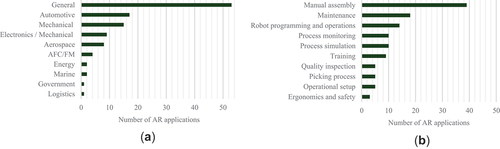
Figure 2. Comparison of the number of criteria evaluated and number of participants in the user study, based on 29 studies.
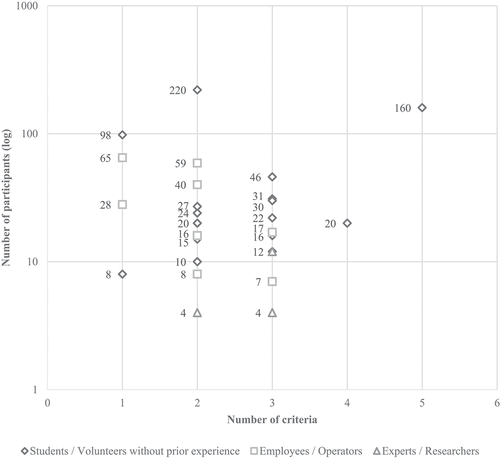
Table 1. Description of the use cases and used devices.
Figure 3. Evaluation model for industrial AR/VR systems, edited and translated from (Zigart, Citation2022).
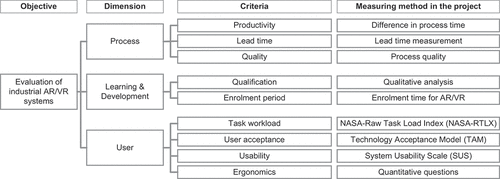
Figure 4. Examples of (a) “7_Maintenance” and (b) “13_Training” use cases.
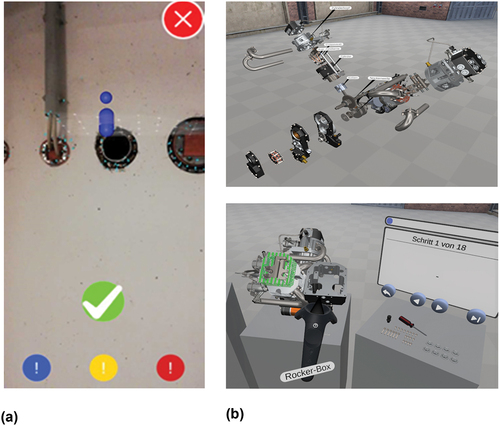
Figure 5. (a) distribution of applications per industrial segments of the manufacturing use cases in our research project (b) distribution of the industrial applicability of the manufacturing use cases in our research project.
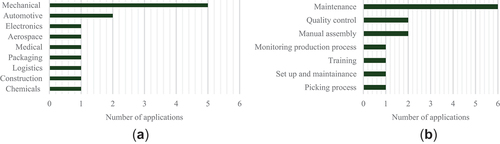
Figure 6. Quality results from interviews.
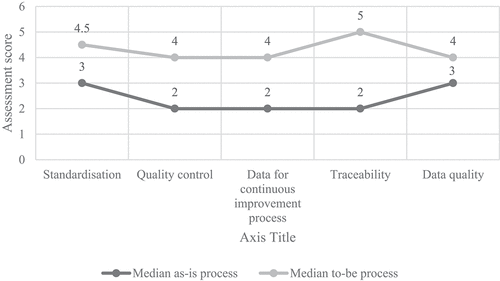
Figure 7. Task load based on NASA-RTLX; a comparison of users (n = 22) and novices (n = 47).
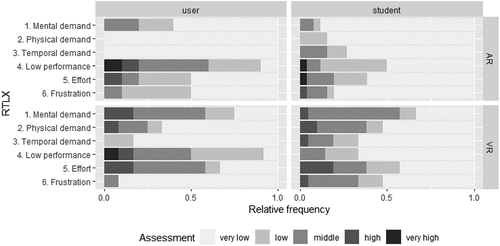
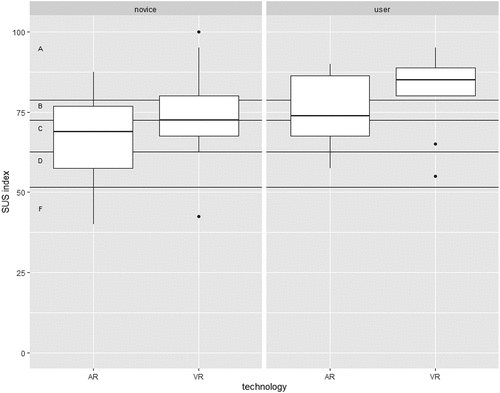
Figure 8. Usability based on SUS index; a comparison of users (n = 22) and novices (n = 47).