
Figures & data
Table 1. The challenges in PM.
Figure 1. The seven phases of this study.
Table 2. Classification of the factors in groups.
Table 3. Best-to-others (BO) comparisons for main group factors.
Table 4. Others-to-Worst (OW) comparisons for main group factors.
Figure 2. Cluster diagram for the global weights of the factors.
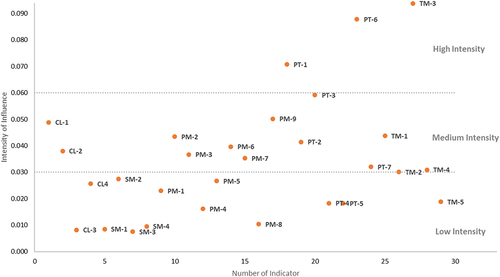
Table 5. Main group weights obtained for the main groups.
Table 6. Global weights of the Factors.
Table 7. Factors considered for fuzzy DEMATEL.
Table 8. The initial direct-Relation Matrix for the main groups in terms of depiction.
Table 9. The initial direct-Relation Matrix for the main groups in terms of numerical equivalent.
Table 10. The fuzzy initial direct-Relation Matrix for the main groups.
Table 11. The fuzzy Total-Relation Matrix for the main groups.
Table 12. The Crisp Total-Relation Matrix for the main groups.
Figure 3. The final cause-effect diagram.
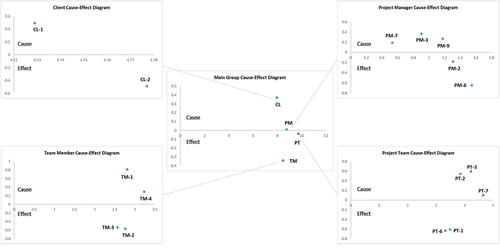
Figure 4. The relationship diagram.
Table 13. Final output for the main groups.
Table 14. The Crisp Total-Relation Matrix for the main groups considering threshold Value.
Supplemental Material
Download PDF (754.6 KB)Data availability statement
Joseph Jerome, Jude Jegan; Sonwaney, Vandana; ON, Arunkumar (2023), ‘Responses to survey on Project Management and Resilient SC’, Mendeley Data, V1, doi: 10.17632/vd2bc8333z.1