Figures & data
Table 1. Research protocol.
Figure 1. Diagram of the search and review process.
Figure 2. Overall process of TT for companies and areas addressed by this research.
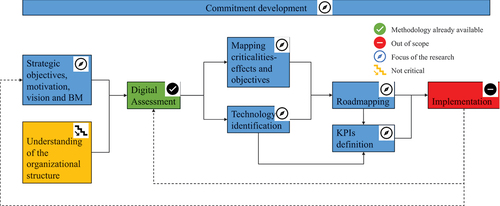
Figure 3. Overview of the main steps of the presented TRM.
Figure 4. Step 2-identification and prioritization of criticalities (qualitative approach).
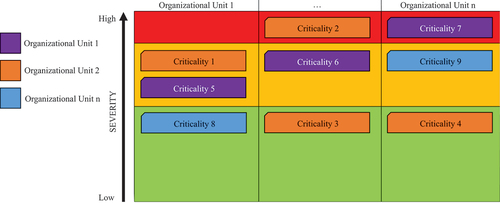
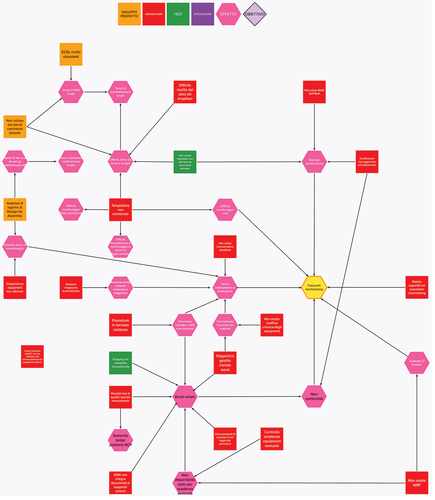
Figure 5. Conceptual scheme of the criticality–effect relationship map.
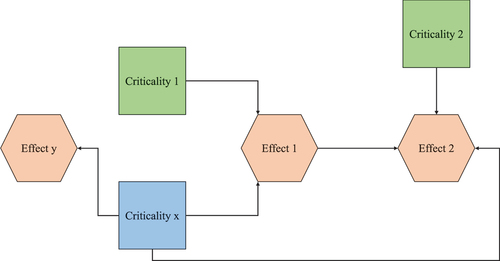
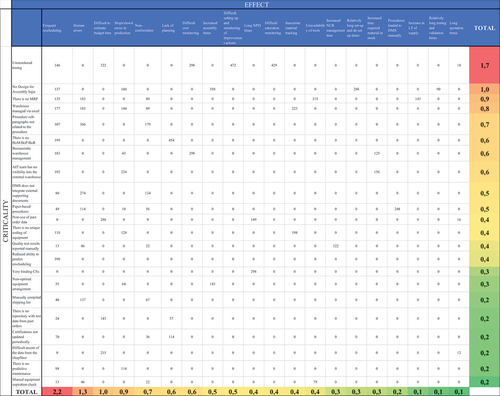
Table 2. Impacts of individual effects on corporate objectives.
Figure 6. Step 2-identification and prioritization of criticalities (quantitative approach) from the visual map to numerical matrix.
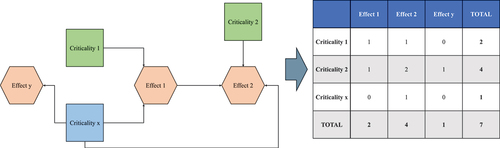
Figure 7. Structure of the TRM graphic output.
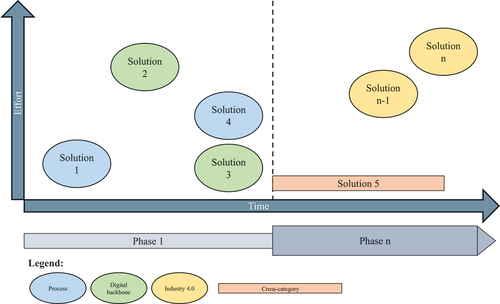
Table 3. Most impacting criticalities and effects and their cumulated impact.
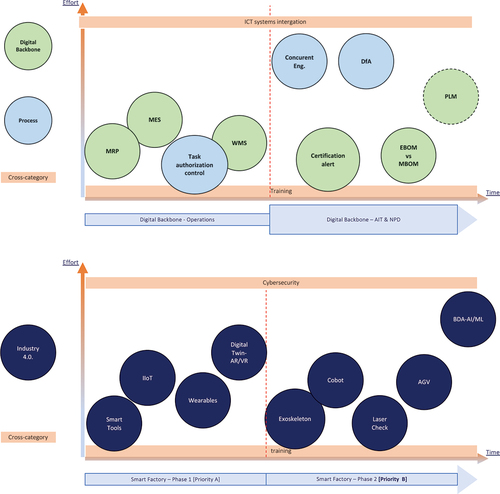
Figure 8. Final roadmap developed and shared with the company.