Figures & data
Figure 1. Simulation and optimisation framework (Iriondo Pascual et al., Citation2021).
Figure 2. Current original solution of the logistics area represented by green box (left), zoomed in (right).
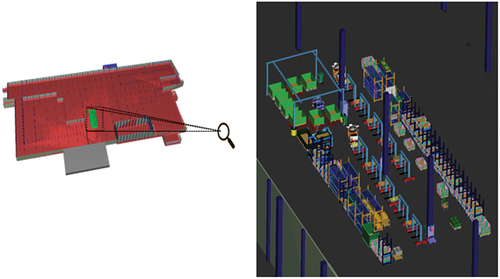
Figure 3. Train stops 1 and 2 for the yellow tugger train at the logistics area, top view.
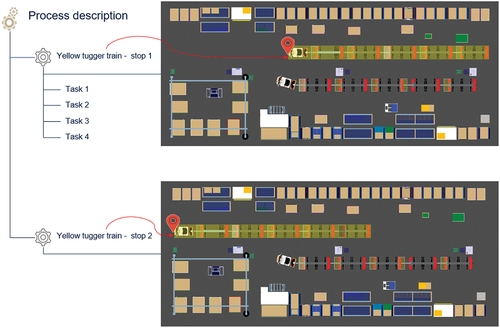
Figure 4. Work sequence for the yellow train’s first stop, see QR code for video.
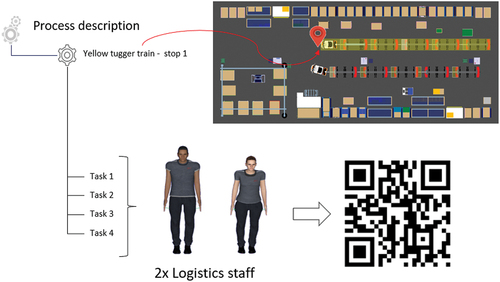
Figure 5. Generation of safety distance reservation for the tugger train.
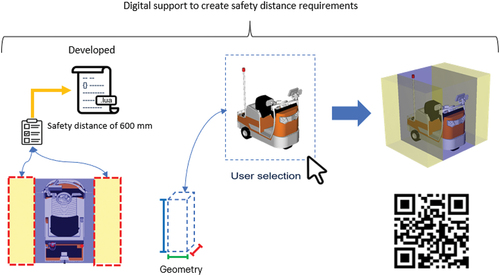
Figure 6. Volume reservation of safety distance of the tugger train path.
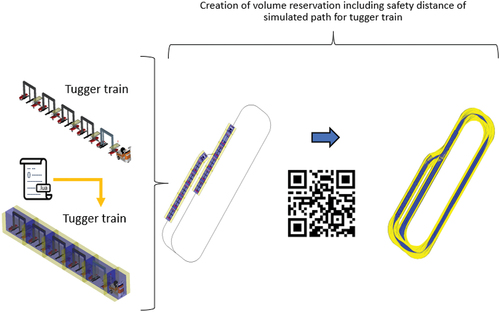
Figure 7. The original solution not fulfilling the safety distance requirements of the tugger train path.
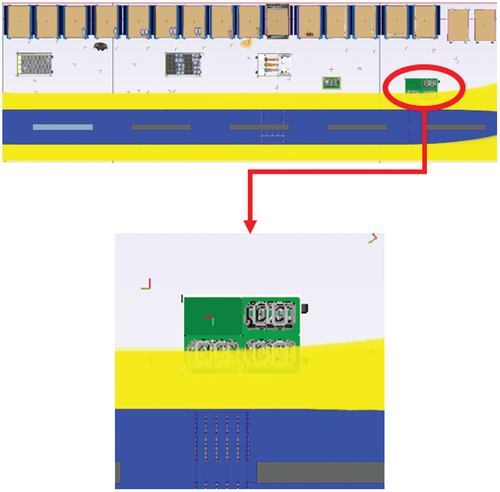
Figure 8. Fifteen permutations for the racks.
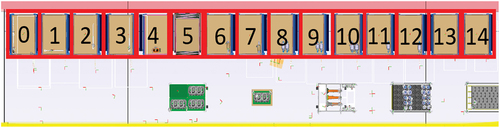
Figure 9. Example of all permutations for three elements defined by node sets n.
Table 1. Lundqvist Index factor with classification according to Höldrich (Citation2011).
Table 2. Configuration of the optimisation algorithm operators.
Figure 10. 3D plot (view 1) of the objectives OWASLIKT, DWKT and DWTT.
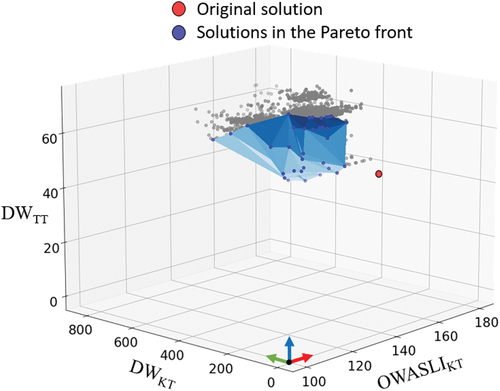
Figure 11. 3D plot (view 2) of the objectives OWASLIKT, DWKT and DWTT.
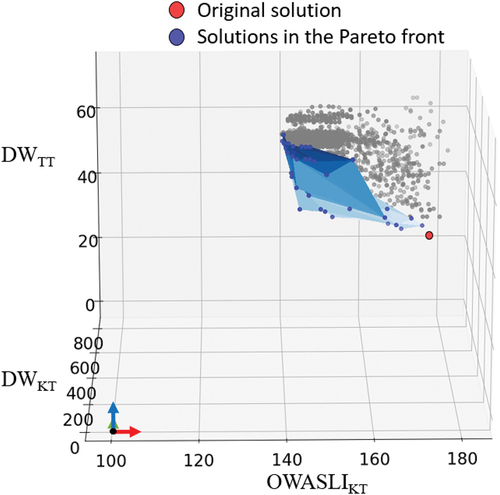
Table 3. Values of the three objectives for the solutions in the pareto front, compared with values of the original solution.
Figure 12. The original solution (top) compared with solution 1 554 (below).
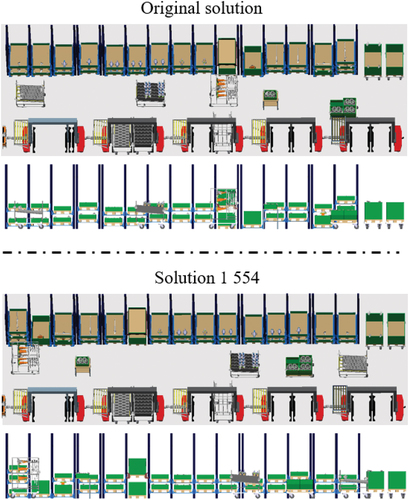
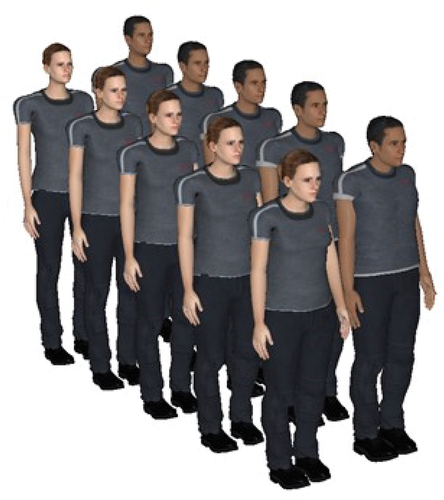
Figure 13. Illustration of a manikin family to represent anthropometric diversity.