Figures & data
Figure 1. Classification of review articles.
Figure 2. PRISMA diagram for showing the article selection process of relevant documents describing the support of ML in manufacturing.

Figure 3. Number of articles included in the current review based on manufacturing functions and publication years.
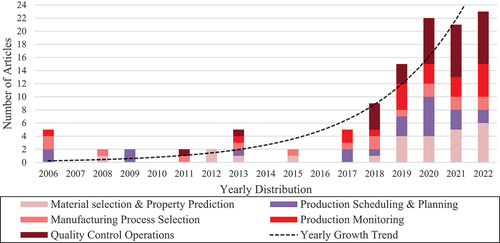
Figure 4. Keyword co-occurrence analysis using VOSviewer.
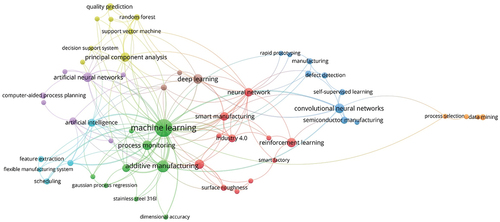
Table 1. Classification of ML support in material selection and parameter prediction articles.
Table 2. Classification of ML support in manufacturing scheduling articles.
Table 3. Classification of ML support in manufacturing process selection articles.
Table 4. Classification of ML support in manufacturing monitoring articles.
Table 5. Classification of ML support in Quality Control Articles.
Figure 5. Number of article distribution based on ML algorithm, supervision, and manufacturing function.
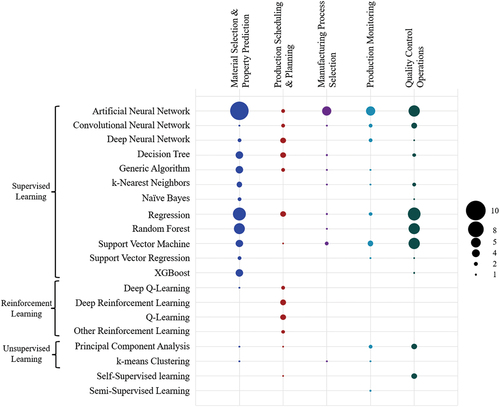
Figure 6. General overview of ML support in manufacturing.
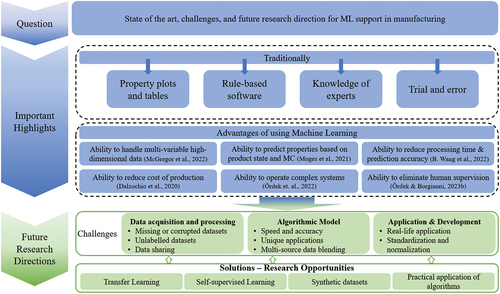
Figure 7. Possible scheme to use transfer learning to transfer knowledge from the research proposed by Song et al. (Citation2020) to the study conducted by J. Wang et al. (Citation2022).
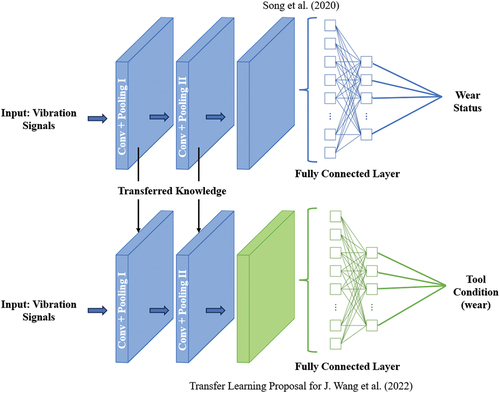
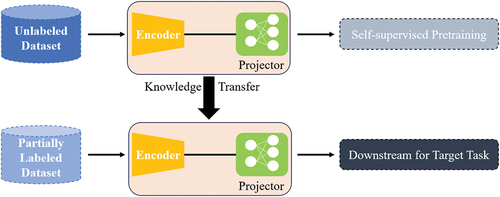
Figure 8. Working principle of a self-supervised learning algorithm.