Figures & data
Figure 1. Steps of the value stream mapping methodology (Rother & Shook, Citation2018).
Figure 2. Matching of value stream mapping aspects and Process Mining types (Horsthofer-Rauch et al., Citation2022).
Figure 3. Concept to create a sustainability-integrated digital value stream mapping according to Horsthofer-Rauch et al. (Citation2021).
Figure 4. Overview of the fulfillment of relevant aspects for Process Mining-enabled sustainability-integrated value stream mapping.
Figure 5. Framework for the implementation of Process Mining-based sustainability-integrated value stream mapping.
Figure 6. Summarizing data ontology for Process Mining-based value stream mapping considering environmental aspects.
Figure 7. Outline of the technical components required for working within the Celonis platform.
Figure 8. Overview of the process of identifying and pre-processing data.
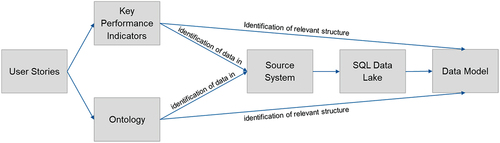
Figure 9. Overview of the procedure for enabling the analysis.
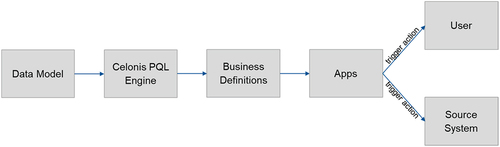
Figure 10. Schematic overview of the functionality of the Process Explorer for the value stream map.
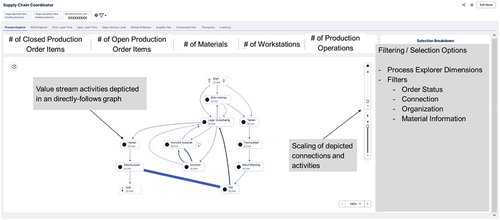
Figure 11. Overview of the product family clustering review dashboard.
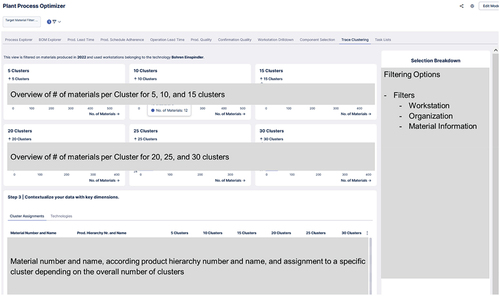
Table 1. Overview of User Stories used for the development of the solution.
Figure 12. Overview of the dashboard for the inventory classification view for User Story 7.
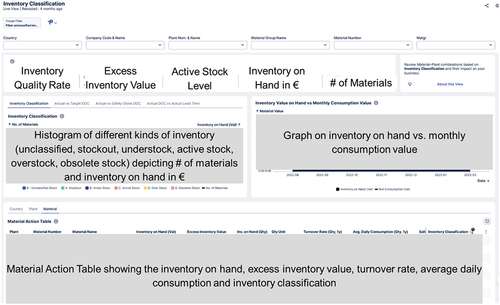
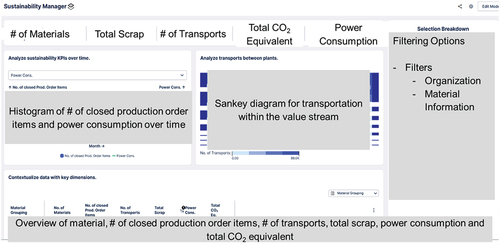
Figure 13. Overview of the sustainability dashboard for User Story 11.