Figures & data
Figure 1. Adaptability classes with corresponding production system levels – based on Andersen (Andersen, Citation2017) and Wiendahl et al. (H.-P. Wiendahl et al., Citation2007).
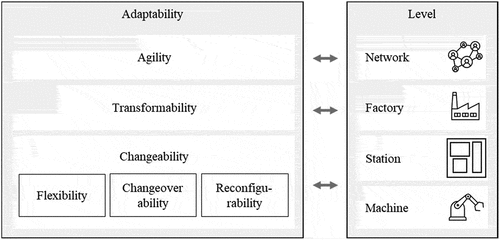
Figure 2. Production volumes over time for manufacturing and remanufacturing – based on Brunoe et al (Brunoe et al., Citation2019). and Matsumoto and Komatsu (Matsumoto & Komatsu, Citation2015).
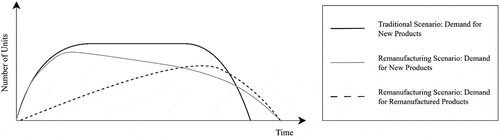
Figure 3. Framework structure and integration of knowledge gathered from the literature.
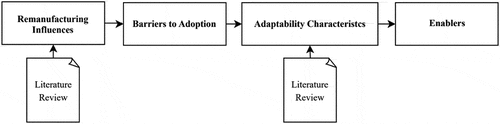
Table 1. Influence classification.
Table 2. Results of the systematic search for adaptable remanufacturing literature.
Figure 4. Overall structure of the resulting framework.
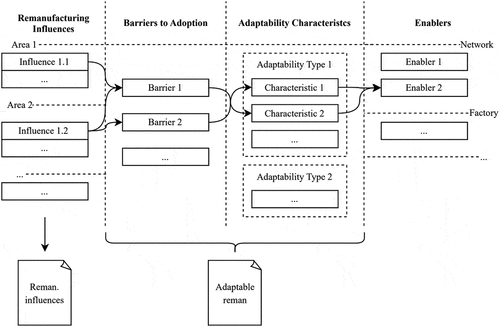
Figure 5. Overview of research topic shares.
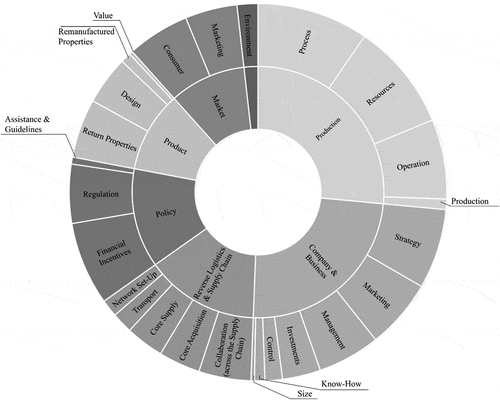
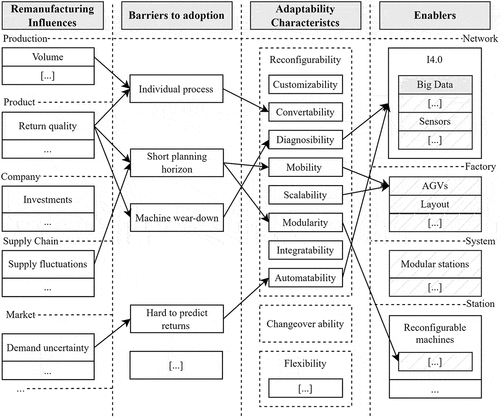
Figure 6. Remanufacturing influences inserted in the framework.
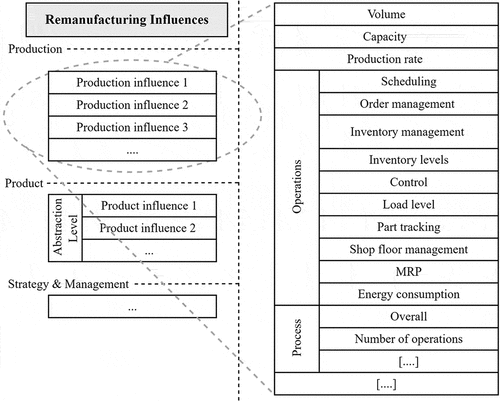
Figure 7. Excerpt of the framework: Connections between primary and secondary barriers.
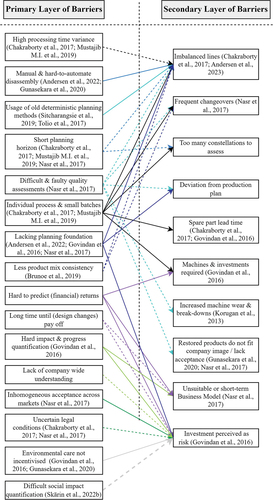
Figure 8. Excerpt of the framework: Links between the barriers to remanufacturing and the classes adaptability classes, indicating beneficial impacts.
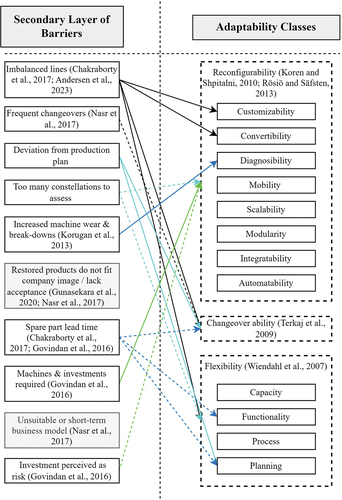
Figure 9. Excerpt of the framework: Exemplary enablers linked to the corresponding adaptability classes.
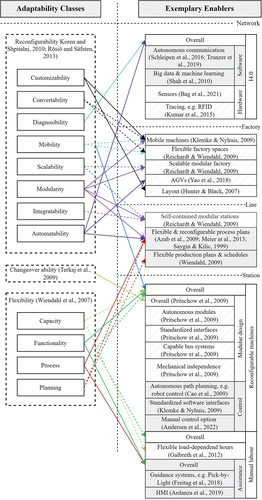
Figure 10. Excerpt of the finished framework.