Figures & data
Table 1. Control limits of the proposed charts under lower dimensions with and
.
Table 2. ARL (SDRL) comparison of Hotelling’s and proposed charts with m = 30, n = 30.
Table 3. Control limits of the proposed charts under higher dimensions.
Table 4. ARL (SDRL) comparison of DR and SD charts with .
Figure 1. Schematic diagram for the implementation of proposed charts.
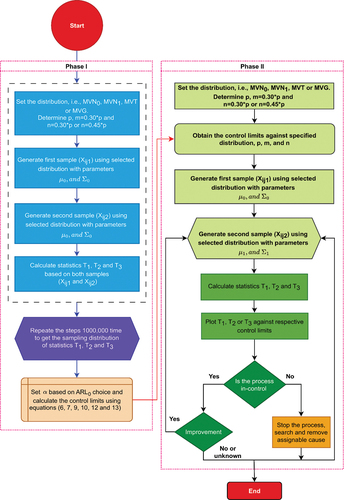
Figure 2. Wind turbine configuration (a) gearbox operated wind turbine (Fierro, Citation2016) and (b) direct-drive wind turbine (Oyague, Citation2009).
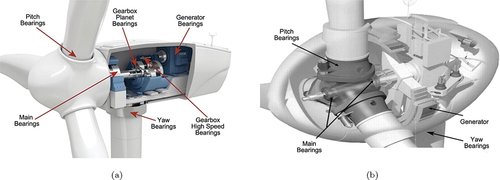
Figure 3. Change point analysis by fitting different models.
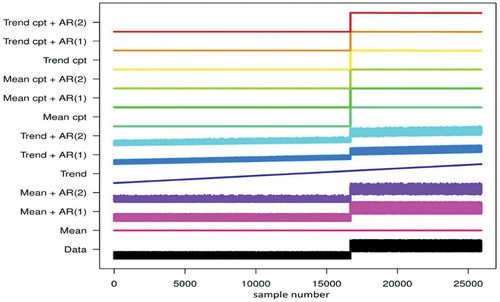
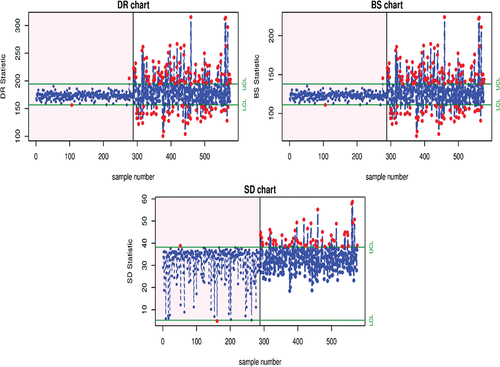
Figure 4. Graphical displays of plotting statistics for DR, BS, and SD charts corresponding to their control limits.