
Figures & data
Figure 1. Field emission scanning electron microscopy (FE-SEM) of a left human hemi-sectioned cochlea with estimated frequency locations. The specimen was coated with gold–palladium with approx. 2 nm resolution. The hearing organ at 0.5–1 kHz is shown in upper right corner. In lower insets, OHCs at low frequency display beaded efferent nerve terminals high up on their shafts (arrows). These neurons express voltage-gated sodium channel NaV1.6 (red staining). Decalcification in Na-EDTA. OHCs: outer hair cells. *Apical end of tectorial membrane. Upper and lower insets photos reproduced with permission for audiological medicine [Citation7].
![Figure 1. Field emission scanning electron microscopy (FE-SEM) of a left human hemi-sectioned cochlea with estimated frequency locations. The specimen was coated with gold–palladium with approx. 2 nm resolution. The hearing organ at 0.5–1 kHz is shown in upper right corner. In lower insets, OHCs at low frequency display beaded efferent nerve terminals high up on their shafts (arrows). These neurons express voltage-gated sodium channel NaV1.6 (red staining). Decalcification in Na-EDTA. OHCs: outer hair cells. *Apical end of tectorial membrane. Upper and lower insets photos reproduced with permission for audiological medicine [Citation7].](/cms/asset/e2c91f54-c221-40c1-adeb-5fa5cfbb9dac/ihbc_a_1807259_f0001_c.jpg)
Figure 2. FE-SEM of the human organ of Corti at the transition zone between the apical and middle turns of the opposed hemi-section in (area 4). The acoustic ridge is approximately 0.2 mm wide. Insets show coexpression of parvalbumin (green) and prestin (red) in OHCs (red). Cell nuclei are blue. OHC: outer hair cell; IHC: inner hair cell; IPC: inner pillar cell; OPC: outer pillar cell; TCF: tunnel crossing fibres; TSB: tunnel spiral bundle; DC: deiters cell; HS: Hensen cell; BM: basilar membrane. Original photo from Anatomical Record 2012. Published with permission provided by John Wiley and Sons and Copyright Licence Number 4821821134443. Inset photo reproduced with permission for Audiological Medicine.
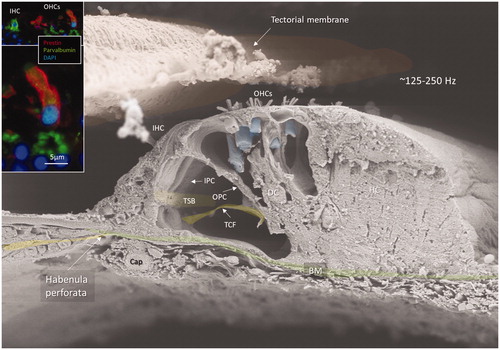
Figure 3. (A) TEM of pillar head surfoskelosomes with actin and associated microtubules. Inset shows framed area and a GJ in higher magnification (GJ width is 120 nm and intercellular distance 10–15 nm). OPS: outer pillar cell and IPC: inner pillar cell. (B) SR-SIM shows actin distribution in the pillar cells. (C) Higher magnification of IHC stereocilia and cuticle (inset) which are positive for actin and transmembrane serine protease 3 (TMPRSS3). (D) TEM of actin conglomerates and associated microtubules in pillars. (E) TEM of OHC rows. (F) Pillar cell connects to the first row OHC.
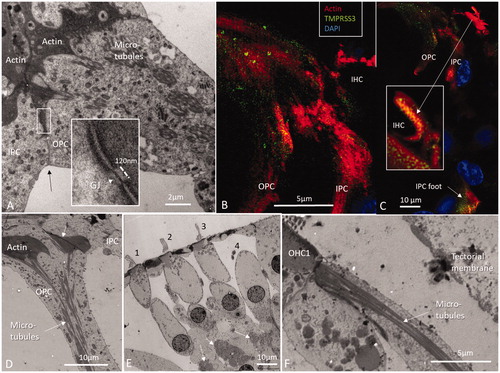
Figure 4. (A) Illustration showing actin and the associated protein TMPRSS3 in the human organ of Corti and their role in cell motility. The proteins co-localize in hair cell stereocilia, cuticles and membrane-associated regions in pillar and Deiters’ cells called surfoskelosomes. In supporting cells, the surfoskelosomes are connected via a system of microtubules. The image on the right shows the putative organization of microtubule–actin at the anchorage to the BM. Here, microtubules also run parallel with the contractile apparatus. They may act as load-bearing spring coils controlling contraction–relaxation of the polarized network during oscillatory vibrations with long-lasting mechanical properties. Microtubules are anchored against the BM through filamentous connections at focal adhesions. Illustration by Karin Lodin.
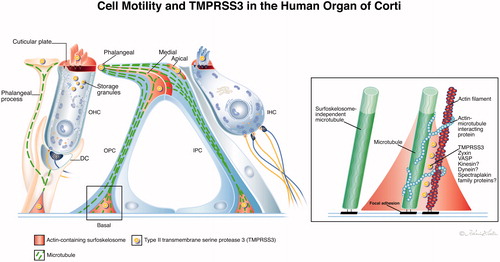
Figure 5. Artist´s drawing of the human spiral limbus and the proposed secretory pathway and uptake of macromolecular substances into the TM. (A) Secretory vesicles (coated pits) coalesce with the apical membrane of the IDCs (lilac) partly submerged in the spiral prominence (lower left TEM). (B) Its content empties into the sub-tectorial space and is taken up by the TM. The jelly-like matrix is comprised of various glycoproteins such as β- and α-tectorin and otogelin and is incorporated into the limbus zone of the TM in close association with the collagen II fibres [Citation37]. (C) Imprints of OHC stereocilia tips on the undersurface tectorin layer. (D) SEM image of the undersurface of the TM. Our SEM study did not show cilia imprints on Hensen’s stripe where the tips of the IHC stereocilia seem to attach. The drawing was done by Karin Lodin. Inset D is from ‘Molecular Organization and Fine Structure of the Human Tectorial Membrane: is It replenished?’ by Hisamitsu Hayashi et al., Cell and Tissue Research, June 18, 2015 [Citation33]. It is used here with permission from Springer Nature, licence and terms provided by Springer Nature and Copyright Clearance Centre, licence number 4821850025140.
![Figure 5. Artist´s drawing of the human spiral limbus and the proposed secretory pathway and uptake of macromolecular substances into the TM. (A) Secretory vesicles (coated pits) coalesce with the apical membrane of the IDCs (lilac) partly submerged in the spiral prominence (lower left TEM). (B) Its content empties into the sub-tectorial space and is taken up by the TM. The jelly-like matrix is comprised of various glycoproteins such as β- and α-tectorin and otogelin and is incorporated into the limbus zone of the TM in close association with the collagen II fibres [Citation37]. (C) Imprints of OHC stereocilia tips on the undersurface tectorin layer. (D) SEM image of the undersurface of the TM. Our SEM study did not show cilia imprints on Hensen’s stripe where the tips of the IHC stereocilia seem to attach. The drawing was done by Karin Lodin. Inset D is from ‘Molecular Organization and Fine Structure of the Human Tectorial Membrane: is It replenished?’ by Hisamitsu Hayashi et al., Cell and Tissue Research, June 18, 2015 [Citation33]. It is used here with permission from Springer Nature, licence and terms provided by Springer Nature and Copyright Clearance Centre, licence number 4821850025140.](/cms/asset/8e81c8ec-f6ed-4abe-a8d7-a54e96778ec3/ihbc_a_1807259_f0005_c.jpg)
Figure 6. (A) Principal drawing of the lateral wall of the human cochlea and super-resolution microscopy. The epithelial layer consists of MCs, ICs, and BCs and is associated with spiral ligament fibrocytes classified into five different categories of I–V. Type I forms a syncytium with the BCs and ICs. Cx26 and cx30 are believed to be essential for ion circulation and recirculation via the outer sulcus and root cells. Apical epithelial TJs express occludin. (B) Image of the lateral insertion of the Reissner’s membrane (RM) at the StV and suprastrial region. The basolateral cell membranes of the MCs express Na/K-ATPase and NKCC1. (C) BCs express insulating lamellae (arrow) expressing TJ protein claudin-11. (D) Framed area in B is shown in higher magnification with expression of the ion transporters Na/K-ATPase and NKCC1. Illustration by Karin lodin.
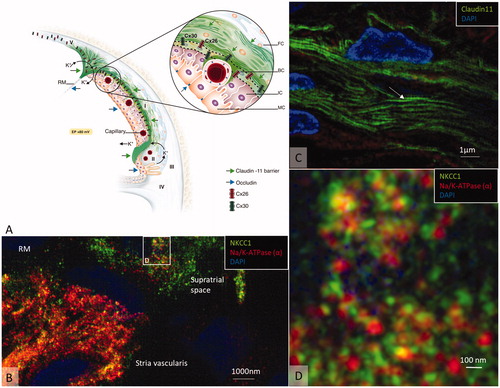
Figure 7. Hypothetical model of the generation of the EP. The green area represents the insulating area expressing claudin-11 TJ. A ‘two-cell model’ was presented by Salt et al. (1987) with ICs, BCs, and fibrocytes (FCs) on one side forming a syncytium and MCs on the other. The syncytium contains ‘gap/tight’ junctions (semiconductors) and the inward rectifying potassium channels Kir4.1 relaying K+ into the intrastrial space. Na/K-ATPase is forcefully expressed in the basolateral MCs, and secretion of K+ into the endolymph is via KCNQ1/KCNE1. Na/K-ATPase could not be detected in type I fibrocytes, but it was in types II and V cells in this study. They are believed to be involved in a recirculation of ions to type I fibrocytes through GJs. Conceivable factors weakening the EP are listed. Illustration by Karin Lodin.
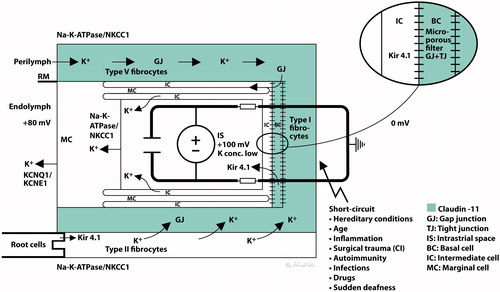
Figure 8. Expression of myelin basic protein (MBP) in the spiral ganglion cell soma in human (A) and pig (B). The axonal initial segments also frequently lack MBP expression in man. Cell perikarya in the pig are completely surrounded by compact myelin (arrow).
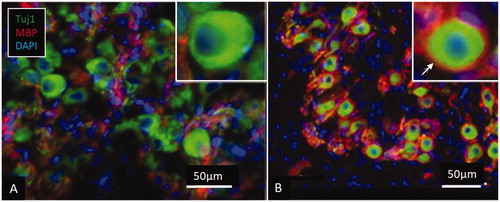
Figure 9. (A) Semi-thin section of a human spiral ganglion from the first turn of the cochlea. Some cell bodies have no separating satellite cell (*). (B) RNA-scope verified gene localization of both β1 and β3 Na/K-ATPase isoforms in the cell soma. These cells also express α3 isoform [Citation6]. (C) Cell bodies and axons express Na/K-ATPase β1 isoform. (D) SR-SIM shows staining of the β1 Na/K-ATPase in cell membranes of opposing cells.
![Figure 9. (A) Semi-thin section of a human spiral ganglion from the first turn of the cochlea. Some cell bodies have no separating satellite cell (*). (B) RNA-scope verified gene localization of both β1 and β3 Na/K-ATPase isoforms in the cell soma. These cells also express α3 isoform [Citation6]. (C) Cell bodies and axons express Na/K-ATPase β1 isoform. (D) SR-SIM shows staining of the β1 Na/K-ATPase in cell membranes of opposing cells.](/cms/asset/642e7a36-0cd2-476e-b3b0-57a7553802d9/ihbc_a_1807259_f0009_c.jpg)