
Figures & data
Table 1. Characteristics and content of the communication group-training at the two participating audiological centres (AC1 and AC2).
Table 2. Baseline characteristics of the included employees at two audiological centres (AC1 and AC2), including demographic, hearing-related, and work-related characteristics.
Figure 1. Scatterplot of the communication strategies (CS) scores before (T0) and directly after (T1) a communication group-training at AC1 (n = 4) and AC2 (n = 5). Dots above the diagonal represent improvement in the communication strategies.
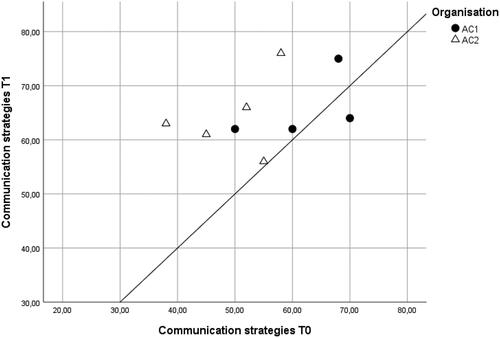
Figure 2. Scatterplot of the personal adjustments (PA) score at before (T0) and directly after (T1) the communication training at AC1 (n = 4) and AC2 (n = 5). Dots above the diagonal represent improvement in personal adjustments.
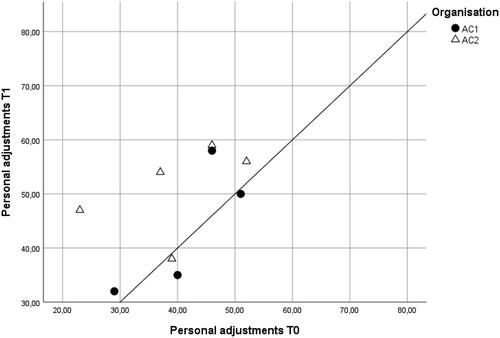
Table 3. Communication strategies, personal adjustments, and need for recovery before (T0) and after (T1) participation of employees participating in a communication group-training at two audiological centres. Questionnaire scores before and after the training are provided as well as the questionnaire change scores.