Figures & data
Figure 1. (a) Axial 3D REAL IR image through the basal turn inferior segment (arrow) and round window. Note the enhancement of the perilymphatic space in the basal turn with focal enhancement also seen in the round window niche - the ‘round window sign’ (arrow head). (b) Axial 3D SPACE image demonstrates T2 hyperintense signal within the round window niche (arrow) at the site of the presumed perilymphatic round window fistula. (c) Cone beam CT image demonstrates soft tissue opacification within the round window niche (arrow) at the site of the presumed perilymphatic round window fistula.
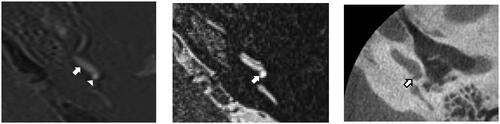
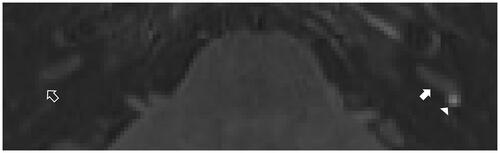
Figure 2. Axial 3D FLAIR image through the basal turn inferior segment (filled arrow) and round window. Note the enhancement of the perilymphatic space in the basal turn with focal enhancement also seen in the round window niche (arrow head). Compare the contralateral round window niche where there is no corresponding enhancement (open arrow).