
Figures & data
Table 1. Chemical compositions of class F fly ash and blast furnace slag.
Table 2. Mixing proportions of fly ash-slag blended ambient air-cured geopolymers.
Figure 1. Geopolymer specimens inside the kiln.
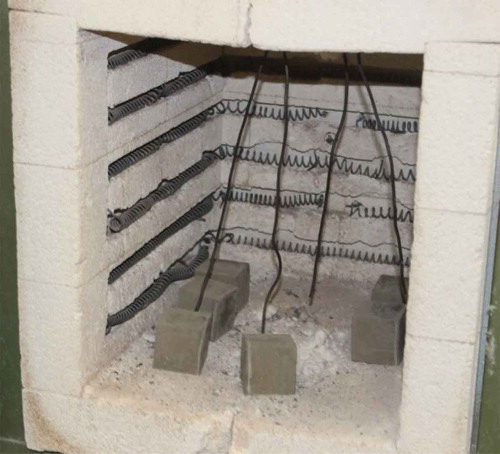
Figure 2. Firing curves for different elevated temperatures in the kiln during heating.
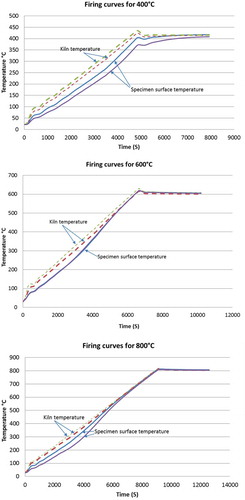
Figure 3. SEM images of ambient air-cured geopolymers containing (a) 5%, (b) 15% and (c) 30% slag as partial replacement for fly ash.
Figure 4. Energy-dispersive X-ray spectroscopy (EDS) analysis of ambient air-cured geopolymers containing (a) 5%, (b) 15% and (c) 30% slag as partial replacement for fly ash.
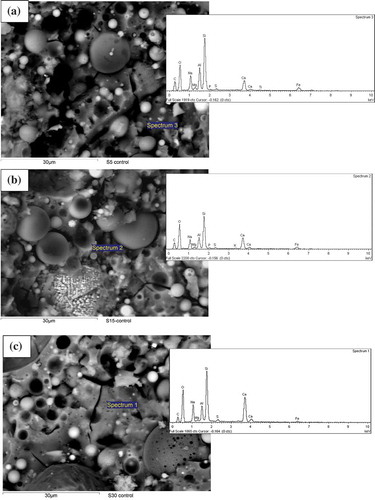
Figure 5. SEM images of ambient air-cured geopolymers containing (a)5%, (b) 15% and (c) 30% slag as partial replacement for fly ash after exposure to a temperature of 400°C.
Figure 6. SEM images of ambient air-cured geopolymers containing (a)5%, (b) 15% and (c)30% slag as partial replacement for fly ash after exposure to a temperature of 600°C.
Figure 7. SEM images of ambient air-cured geopolymers containing (a)5%, (b) 15% and (c) 30% slag as partial replacement for fly ash after exposure to a temperature of 800°C.
Figure 8. XRD analysis of ambient air-cured geopolymers containing 5, 15 and 30% slag and fly ash geopolymers.
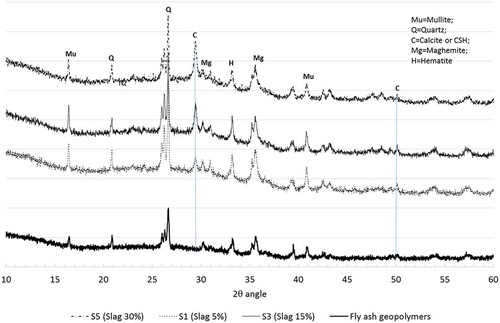
Figure 9. XRD analysis of ambient air-cured geopolymers containing (a) 5%, (b) 15% and (c) 30% slag as partial replacement for fly ash after exposure to 400, 600 and 800°C temperatures.
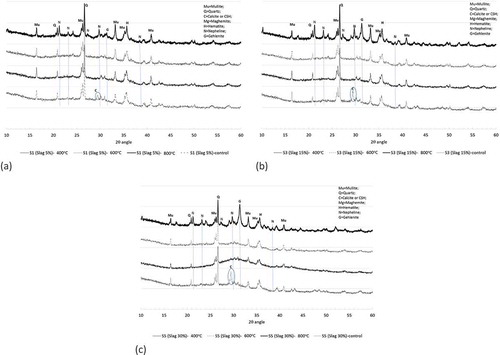
Figure 10. Comparison of XRD analysis of ambient air-cured geopolymers containing various slag contents and fly ash geopolymers after exposure to a temperature of 800°C.
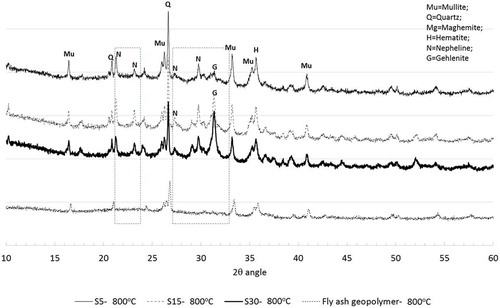
Figure 11. TGA analysis of ambient air-cured geopolymers containing various slag contents and fly ash geopolymers.
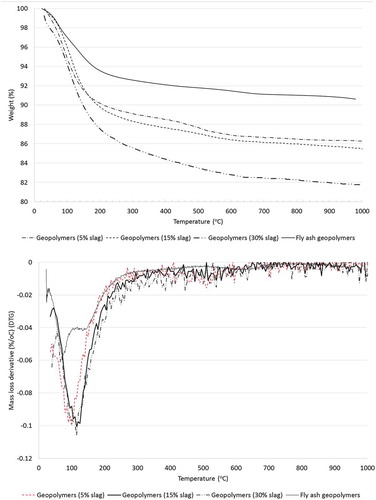
Figure 12. Pore size distribution of various fly ash-slag blended geopolymers and fly ash geopolymers.
Figure 13. Mass loss of ambient air-cured geopolymers containing various slag contents after exposure to elevated temperatures.
[Note: S0 represents 100% fly ash geopolymers].
![Figure 13. Mass loss of ambient air-cured geopolymers containing various slag contents after exposure to elevated temperatures.[Note: S0 represents 100% fly ash geopolymers].](/cms/asset/42b28cec-1eaf-443e-8bce-78fb3a3c5eea/tace_a_1529013_f0013_oc.jpg)
Figure 14. Volume loss of ambient air-cured geopolymers containing various slag contents after exposure to elevated temperatures.
[Note: S0 represents 100% fly ash geopolymers].
![Figure 14. Volume loss of ambient air-cured geopolymers containing various slag contents after exposure to elevated temperatures.[Note: S0 represents 100% fly ash geopolymers].](/cms/asset/e90da9ad-af51-499c-973b-4c616ae570af/tace_a_1529013_f0014_oc.jpg)
Figure 15. Cracking behaviour of ambient air-cured geopolymers containing various slag contents after exposure to elevated temperatures.
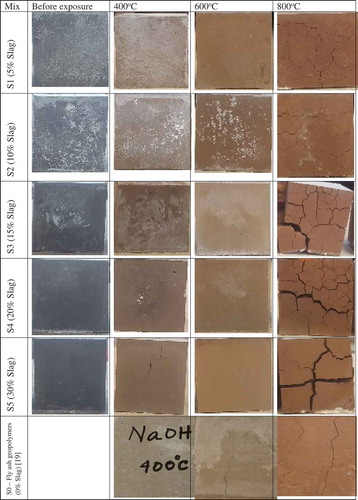
Figure 16. Compressive strength of ambient air-cured geopolymers containing various slag contents before and after exposure to elevated temperatures.
[Note: S0 represents 100% fly ash geopolymers].
![Figure 16. Compressive strength of ambient air-cured geopolymers containing various slag contents before and after exposure to elevated temperatures.[Note: S0 represents 100% fly ash geopolymers].](/cms/asset/128d05e6-2233-453b-84ae-abc292049230/tace_a_1529013_f0016_oc.jpg)
Figure 17. Percentage loss of compressive strength of ambient air-cured geopolymers containing various slag contents after exposure to elevated temperatures.
[Note: S0 represents 100% fly ash geopolymers].
![Figure 17. Percentage loss of compressive strength of ambient air-cured geopolymers containing various slag contents after exposure to elevated temperatures.[Note: S0 represents 100% fly ash geopolymers].](/cms/asset/cd351e19-d594-4451-ac2c-3410cf39afcf/tace_a_1529013_f0017_b.gif)