Figures & data
Figure 1. Schematic of the sintering processes (a) and synthesis to the fabrication of HAp porous composite scaffolds (b).
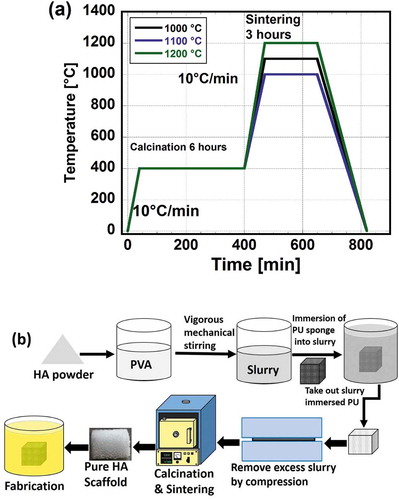
Figure 3. FE-SEM porous microstructures of pure and fabricated scaffolds at 95% (a), 75% (b) and 50% (c) compressive rate sintering at 1000°C, 1100°C, and 1200°C.
Table 1. Variations in porosity of fabricated biomaterials at different compressive ratios and sintering temperatures.
Figure 4. Mechanism of reducing porosity and strengthening of HAp scaffolds fabricated by collagen with 95% compressive ratio, sintering at 1000°C (a), 1100°C (b), and 1200°C (c).
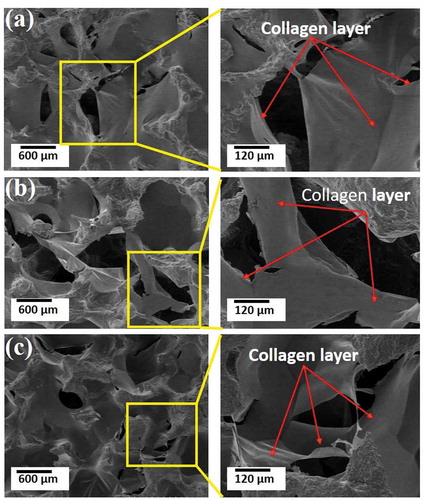
Figure 2. Typical XRD patterns of the pure HA powder (a) and HAp-COL/HAp scaffolds sintering at 1000°C (b), 1100°C (c) and 1200°C (d).
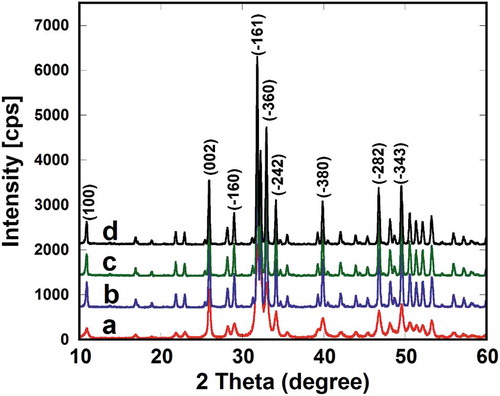
Figure 5. Typical fracture mechanisms of pure Hap (a), HAp-COL (b), and HAp-COL/HAp scaffolds (c).
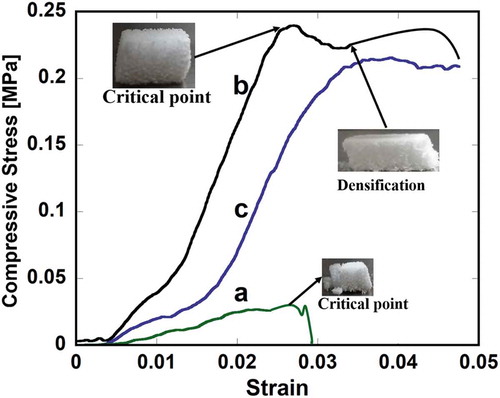
Figure 6. Microscopic fracture mechanism of HAp scaffolds fabricated by collagen at 50% compressive rate sintering at 1000°C (a), 1100°C (b), and 1200°C (c).
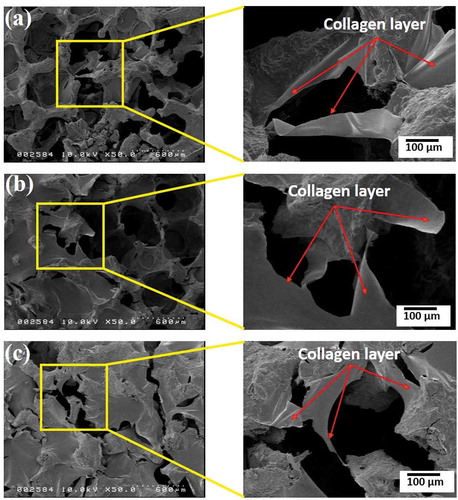
Figure 7. Effects of compressive ratio and sintering temperature on the compressive modulus of fabricated biomaterials. Here, (a), (b), and (c) stand for pure HAp, fabricated HAp-COL, fabricated HAp-COL/HAp scaffolds. Each data represented mean ± SD, n = 3, *p < 0.05.
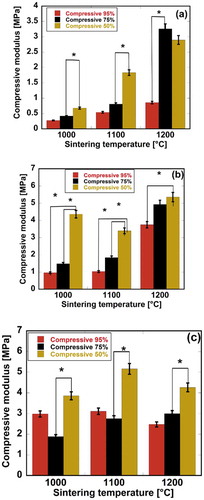
Figure 8. Effects of compressive ratio and sintering temperature on the fracture stress of fabricated biomaterials. Here, (a), (b), and (c) stand for pure HAp, fabricated HAp-COL, fabricated HAp-COL/HAp scaffolds. Each data represented mean ± SD, n = 3, *p < 0.05.
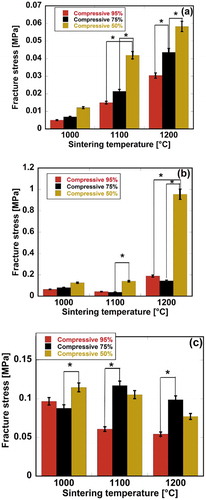
Figure 9. Effects of compressive ratio and sintering temperature on strain energy density of fabricated biomaterials. Here, (a), (b), and (c) stand for pure HAp, fabricated HAp-COL, fabricated HAp-COL/HAp scaffolds. Each data represented mean ± SD, n = 3, *p < 0.05.
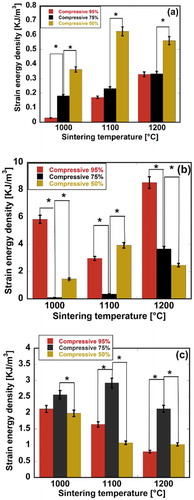
Figure 10. FE-SEM micrographs of hMSCs in fabricated HAp-COL and HAp-COL/HAp composite scaffolds at 50% compressive rate and sintering at 1000°C (A), 1100°C (B) and 1200°C (C) up to 7 days of culture. Here, (a), (c), (e), and (b), (d), (f) indicate HAp-COL and HAp-COL/HAp composite scaffolds, respectively.
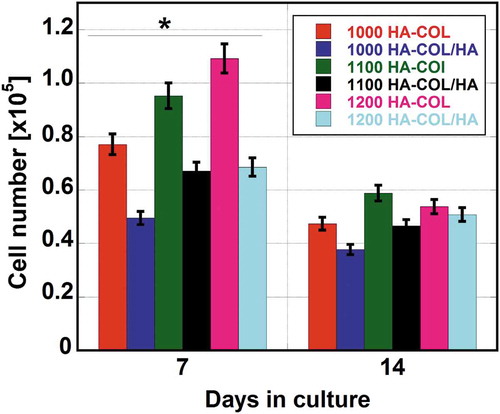
Figure 11. The Proliferation of hMSCs in fabricated HAp-COL and HAp-COL/HAp composite scaffolds at 50% compressive rate and sintering at 1000, 1100, and 1200°C up to 14 days of culture. Each data represent mean ± SD, n = 6, *p < 0.05.