Figures & data
Table 1. Chemical compositions of kaolin (Dib0), rice husk ash (RHA), eggshell, and eggshell-900, %wt. LOI: Loss of ignition at 1000°C for 2 h.
Figure 1. Particle size distribution of rice husk ash and precipitated silica.
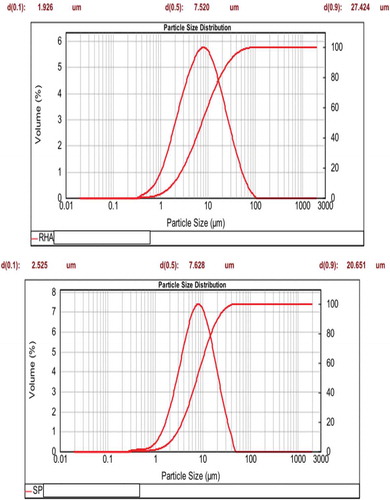
Figure 2. X-ray patterns of calcium hydroxide (CH), microcomposite (SCaS), and nanocomposite (ACaS). C, CH, CSH, and Ca denote reflection peaks of cristobalite, calcium hydroxide, calcium silicate hydrate, and calcite, respectively.
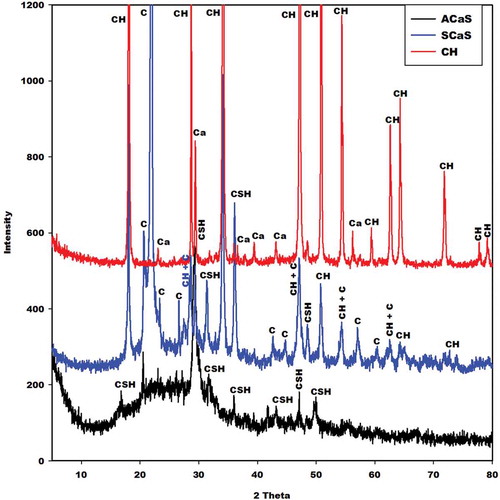
Figure 3. Infrared spectra of calcium hydroxide (CH), nanocomposite (ACaS) and microcomposite (SCaS).
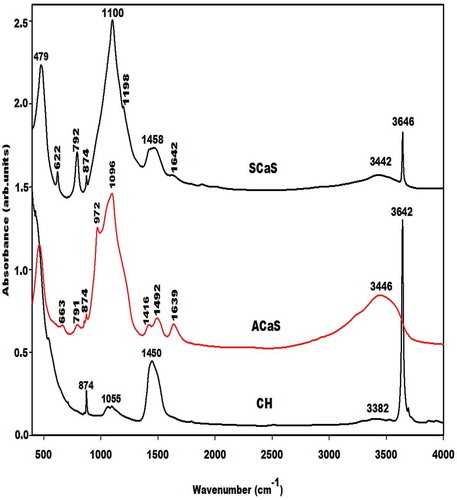
Figure 4. X-ray patterns of the selected metakaolin-based geopolymer cements G0, GSCaS10, GACaS10, and GCH10.
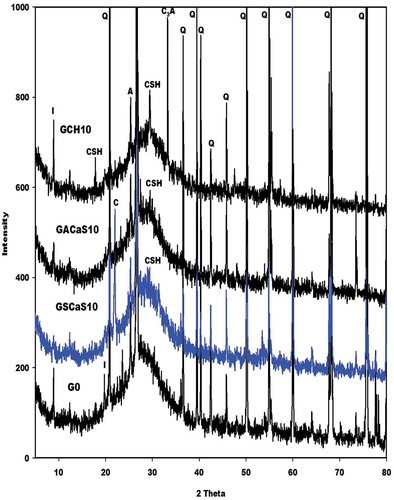
Figure 5. Infrared spectra of metakaolin-based geopolymer cements G0, GCH10, and GCH20.
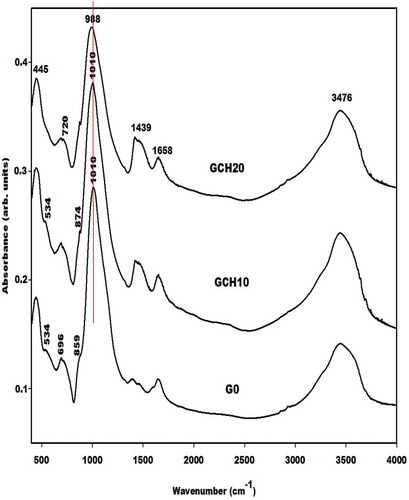
Figure 6. Infrared spectra of metakaolin-based geopolymer cements G0, GACaS10, and GACaS 20.
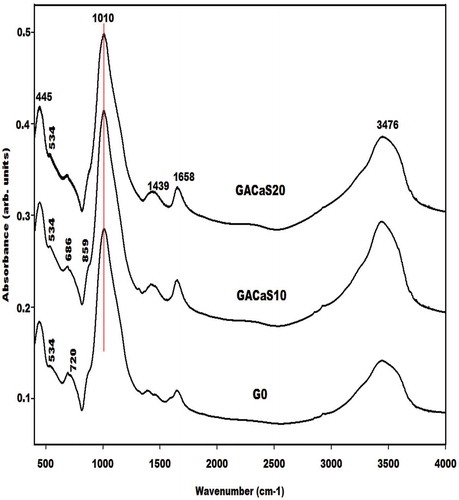
Figure 7. Infrared spectra of metakaolin-based geopolymer cements G0, GSCaS10, and GSCaS 20.
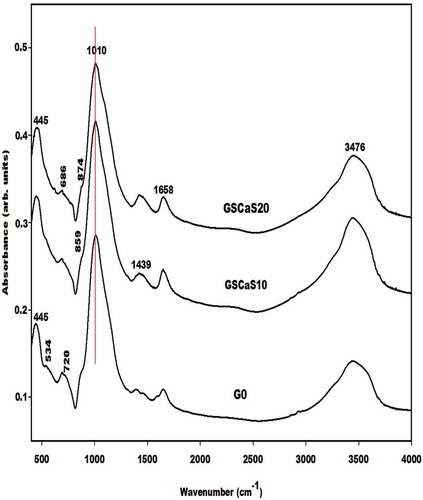
Figure 8. Apparent density of metakaolin-based geopolymer cements.
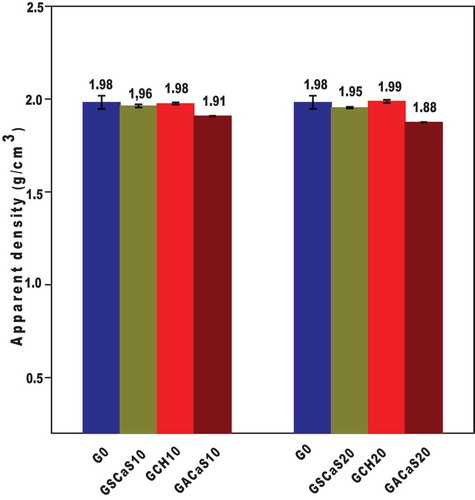
Figure 9. Compressive strengths of metakaolin-based geopolymer cements.
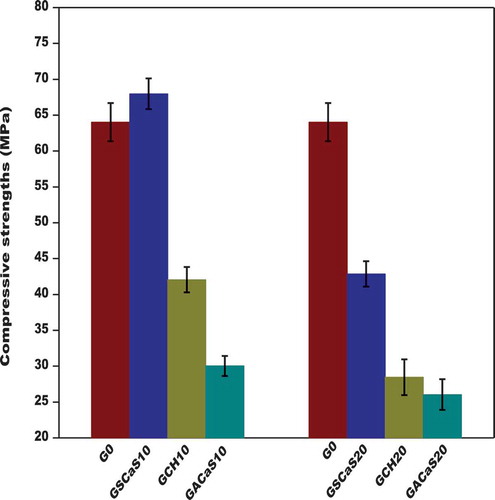
Figure 10. Micrograph images of the selected metakaolin-based geopolymer cements G0, GSCaS10, GACaS10, and GCH10.
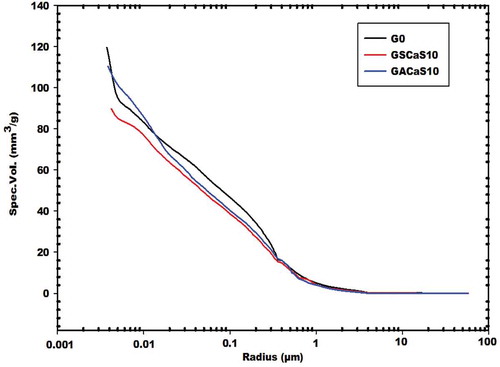
Figure 11. Cumulative specific intrusion volumes versus average pore size radius.