
Figures & data
Figure 1. Figure abstract of overall experimental design
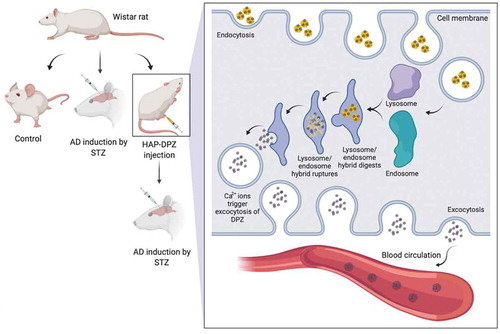
Figure 2. The experimental design. Design of the study for the AD induction, HAP-DPZ prevention, and morris water maze
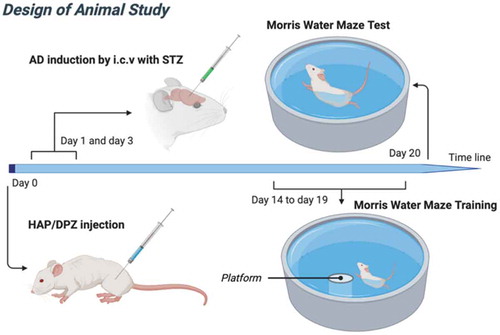
Figure 3. X-ray diffraction pattern of HAP-DPZ. All the characteristic peaks were matched to those of the standard pattern of HAP (JCPD card of 09–0432)
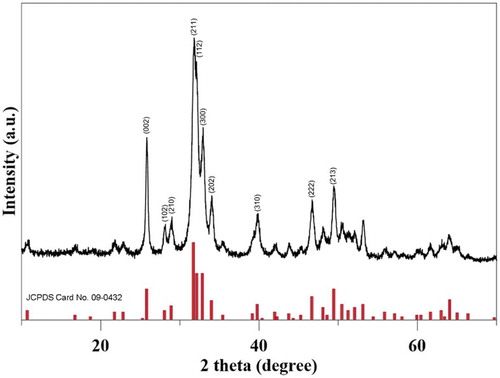
Figure 4. FTIR spectra of HAP, DPZ, and HAP-DPZ. The identification of absorption bands matched to the HAP and DPZ
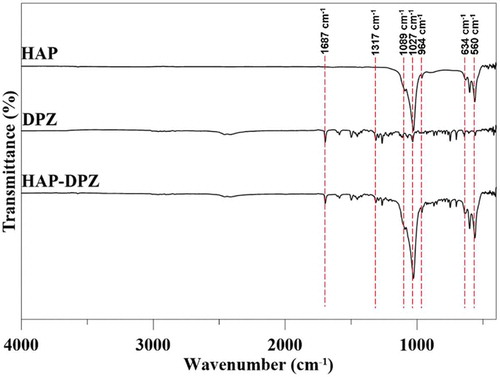
Figure 5. (a) SEM images of HAP-DPZ at 20 k ×. The images show an open and interconnected porous structure within the HAP-DPZ. (b) Size distribution of HAP-DPZ particles analyzed by DLS. Data indicate that the particle size was in the range of 900−2000 nm
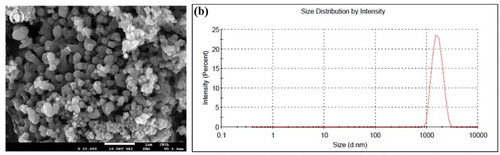
Table 1. BET surface area and porosity of meso-HAP. Where the BET surface area was 26.0947 m2/g, langmuir surface area was 40.5799 m2/g, and the porosity was 50.1%
Figure 6. Flash points of different compounds examined by TGA. The flash point of HAP. The TGA curve of HAP-DPZ showed a weight loss of 13% between 200 and 250ºC, which corresponds to the percentage of DPZ loaded in HAP
Figure 7. Cumulative DPZ release from HAP particles. DPZ absorbance was measured spectrophotometrically at 264 nm. At pH 7.4, 15% of DPZ was released from HAP-DPZ in the first day, and no further DPZ was released from HAP-DPZ thereafter. When in pH 4.5, HAP-DPZ was dissolved, and 90% of DPZ was released in the first day
Figure 8. (a) Cell viability and cytotoxicity tests for HAP-DPZ. WST-1 test in 3T3 cells was performed using HAP-DPZ at days 1, 2, and 3 (n = 6). Data suggest no significant effect on cell viability by HAP-DPZ. (b) LDH test was performed in 3T3 cells at days 1, 2, and 3 (n = 6). The results suggest that HAP-DPZ did not induce cytotoxicity
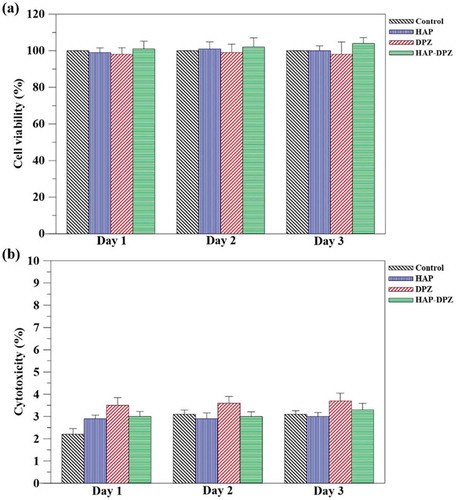
Figure 9. Learning and memory ability of rats by Morris water maze test. The times of spatial retention in the section with the hidden platform during the probe trial (n = 6). The time spent by rats of the HAP-DPZ group in the section with the hidden platform was much lower compared with that of rats of the AD group. (*** is p < 0.001 comparing to control, ** is p < 0.01 comparing to control, # is p < 0.05 comparing to ADI)
Supplemental Material
Download MS Word (127.6 KB)Availability of data and material
The datasets used and/or analyzed in the current study are available from the corresponding author on reasonable request.