Figures & data
Figure 1. Characteristics of magnesium PEO layers
Table 1. Short name of samples
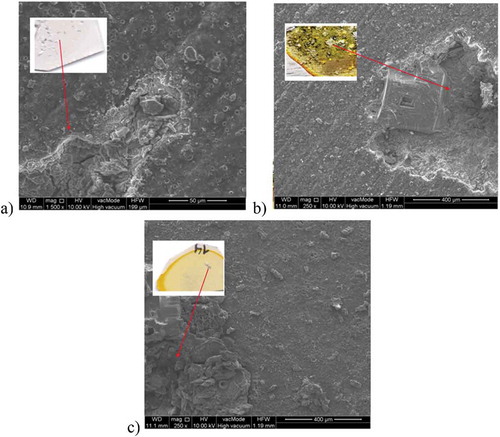
Figure 2. Surface morphology of magnesium alloy: a) Mg/PEO surface and b) cross-section and c) Mg/PEO/primer, view at an angle; SEM
Figure 3. EDS spectrum and chemical composition of Mg/PEO
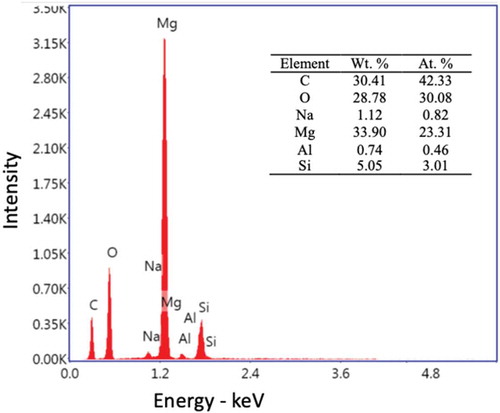
Figure 4. Elemental surface mapping of Mg/PEO: a) cross-section of SEM image of analyzed surface, b) mapping of whole cross-section, c) C content, d) O content, e) Mg content, f) Si content, g) Al content and h) Na content
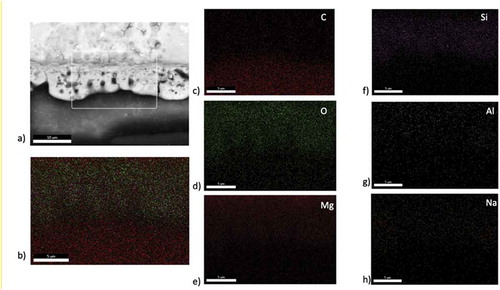
Figure 5. XRD patterns of PEO coating on Mg alloy
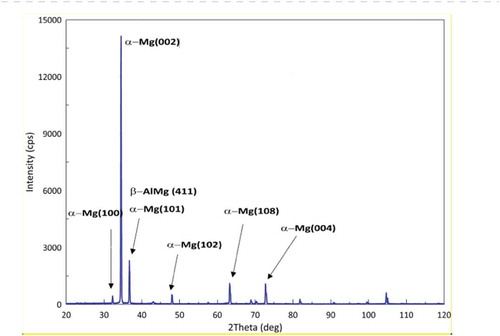
Figure 6. Survey of XPS spectra of surface PEO layer formed on Mg alloy (AZ31) and contaminations of PEO coating on Mg alloy (AZ31)
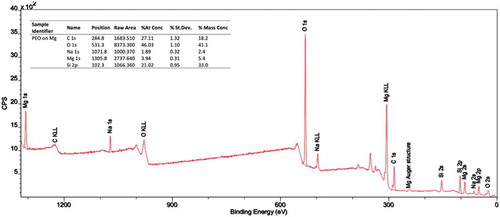
Figure 7. Graphs and track of scratch test for coatings: a) Mg/Primer and b) Mg/PEO/Primer
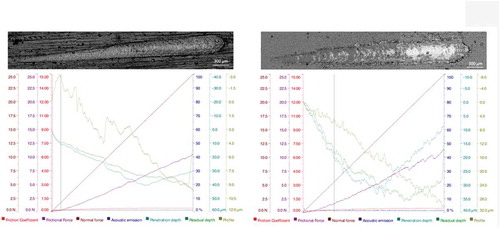
Figure 8. Linear polarization curves of 0.5 M NaCl potentiodynamic test: a) Mg/PEO, b) Mg/Primer, c) Mg/PEO/Primer
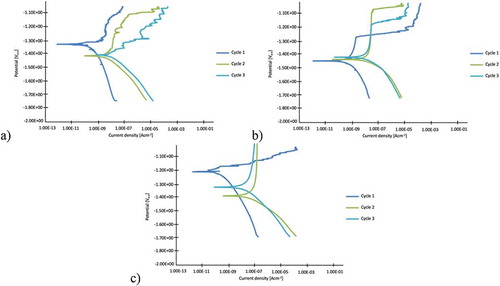
Table 2. Corrosion parameters of samples
Figure 9. Macro- and microstructure of: a) Mg/PEO, b) Mg/Primer, c) Mg/PEO/Primer in 0.5 M NaCl; SEM
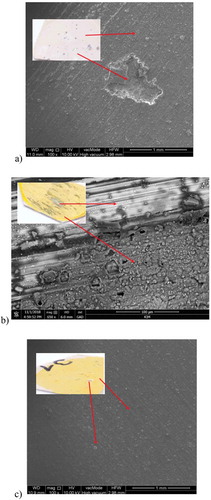
Figure 10. Bode plots of immersed samples: a) Mg/PEO-1 h, b) Mg/PEO-150 h and c) Mg/Primer-1 h d), Mg/Primer-150 h and e) Mg/PEO/Primer-1 h f) Mg/PEO/Primer-150 h
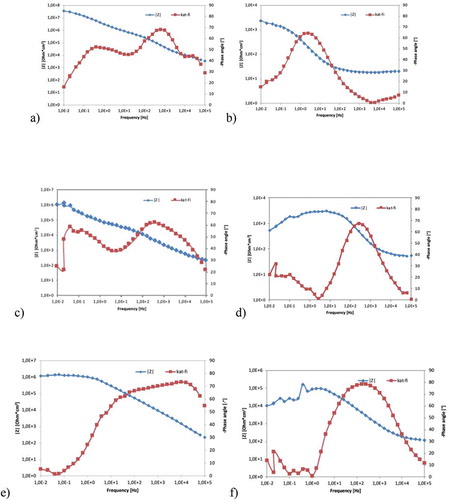
Figure 11. Nyquist plots of: a) Mg/PEO, b) Mg/Primer, c) Mg/PEO/Primer immersion after 1 h and 150 h
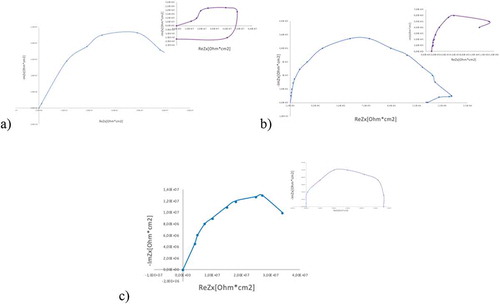
Figure 12. Equivalent circuit of EIS curves: a), b) Mg/PEO, c), d) Mg/Primer, e), f) Mg/PEO/Primer immersion after 1 h and 150 h
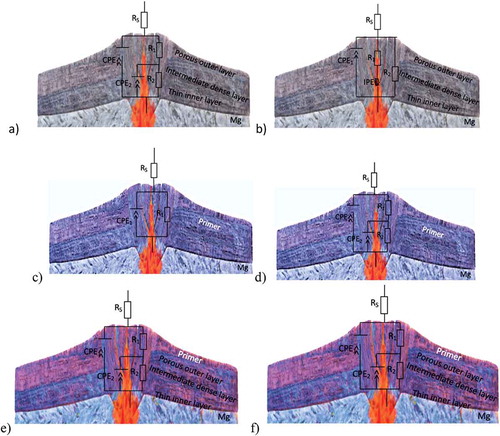
Figure 13. Macro- and microscopic view of: a) Mg/PEO b) Mg/Primer, c) Mg/PEO/Primer after 150 h of immersion in 0.5 M NaCl; SEM