
Figures & data
Figure 1. XRD spectra of as-prepared ZnO and annealed ZnO Thin film
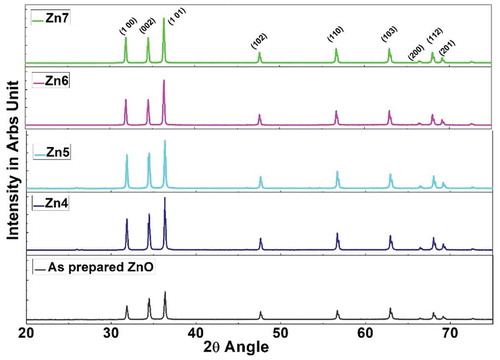
Figure 2. Diffraction Spectra of (101) orientation of ZnO and annealed ZnO Thin film
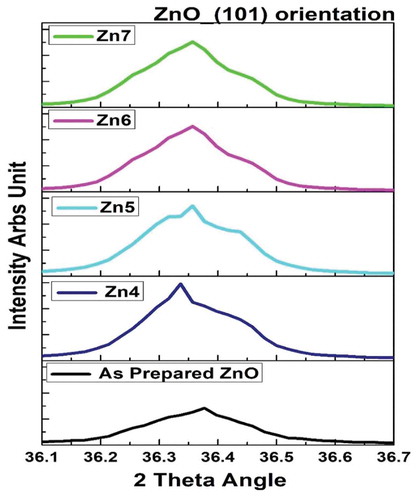
Table 1. Lattice parameters using XRD
Table 2. Microstructure analysis using XRD
Figure 3. Effect of annealing temperature on grain size and texture coefficient of ZnO thin film samples
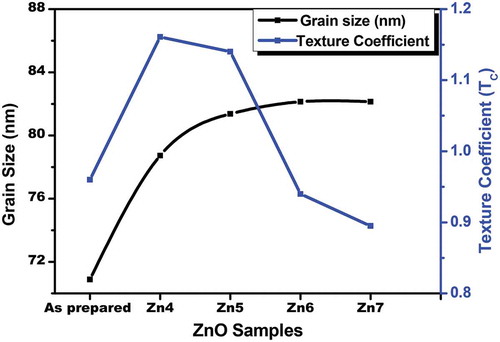
Figure 4. (a) Absorbance spectra (b) Tauc’s plot of ZnO Thin Film Samples
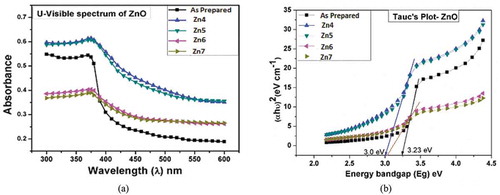
Figure 5. Effect of annealing on energy band gap of ZnO thin film
Figure 6. (a) FESEM and (b) Energy dispersive spectroscopy images of as-prepared ZnO thin film
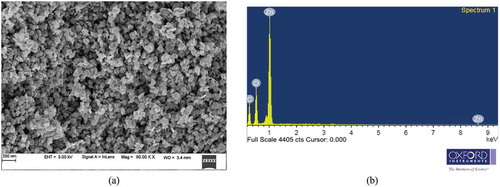
Figure 7. Structural variation of ZnO thin film after annealing for an hour at various temperatures: (a) 400° C (b) 500° C (c) 600° C (d) 700° C
Table 3. EDS analysis
Figure 8. Gas sensing setup (a) Gas chamber (b) Electrode assembly (CeNSE Lab, Indian Institute of Science, Bangalore)
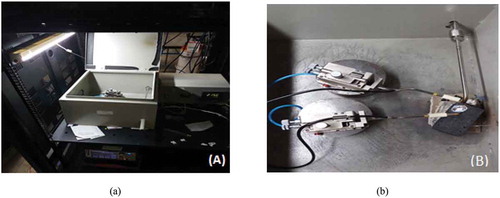
Figure 9. Nitric oxide gas response – ZnO thin film sensors at an operating temperature of 150°C
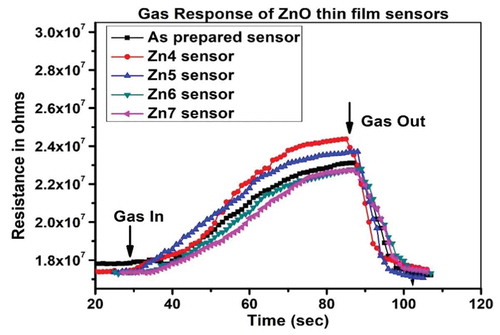
Figure 10. At an operating temperature of 150°C (a) Sensitivity (b) Response and recovery time of various ZnO sensors
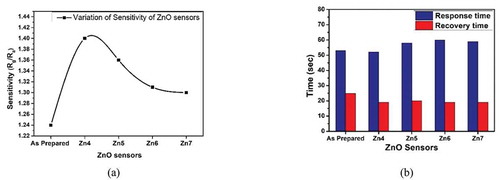
Figure 11. (a) Sensitivity curve (b) Response time and recover time – Zn4 sensor at different operating temperatures
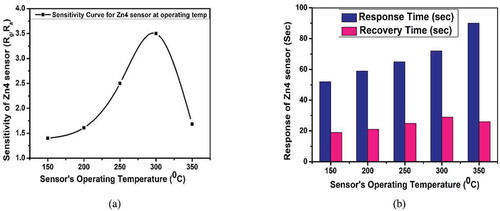
Table 4. Response and recovery time for ZnO and other material-based sensors toward NO gas