Figures & data
Figure 1. XPS survey spectra of (Ba0.5Sr0.5)(Al0.2-xMgxFe0.8)O3-ξ (x = 0, 0.05, 0.10, 0.20) powder samples indicating peaks belonging to different elements. Carbon 1s peak, taken as standard, is also shown
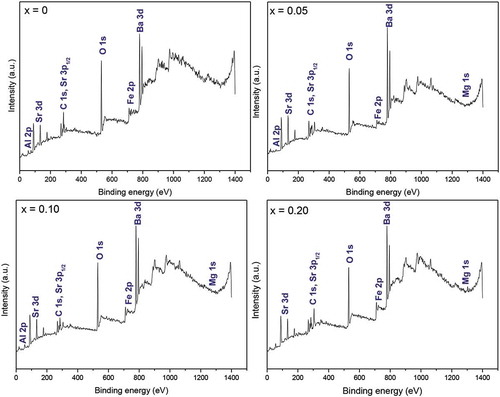
Figure 2. XPS spectra of (Ba0.5Sr0.5)(Al0.2-xMgxFe0.8)O3-ξ (x = 0, 0.05, 0.10, 0.15, 0.20) showing (a) Ba 3d3/2 and 3d5/2 levels and (b) their deconvoluted fitting curves for the composition (x) = 0.05, 0.10, 0.20
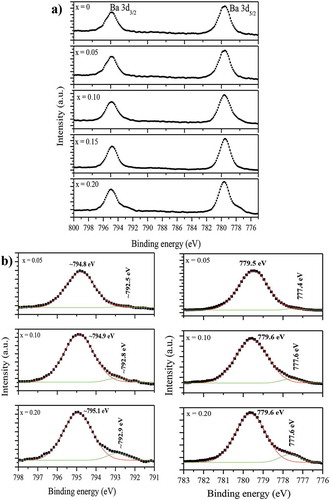
Figure 3. XPS spectra of (Ba0.5Sr0.5) (Al0.2-xMgxFe0.8) O3-ξ (x = 0–0.20) showing Sr 3d3/2 and Sr 3d5/2 levels
Figure 4. XPS Al 2p and Mg 1s spectra of (Ba0.5Sr0.5) (Al0.2-xMgxFe0.8) O3-ξ for the composition x = (0, 0.05, 0.10) and (0.05, 0.10, 0.20), respectively
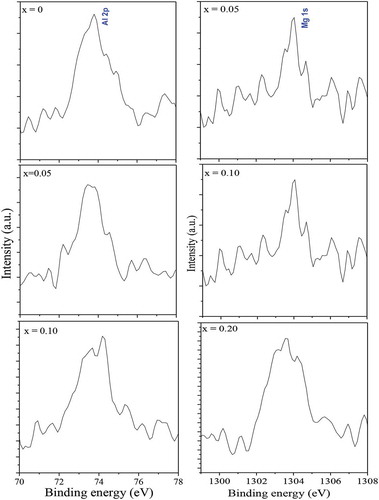
Table 1. XPS parameters of Ba 3d3/2 and Ba 3d5/2 levels in (Ba0.5Sr0.5) (Al0.2-xMgxFe0.8) O3-ξ (x = 0.05, 0.10, 0.20)
Figure 5. Typical XPS spectra (open circles) and fitted curves of (Ba0.5Sr0.5)(Al0.2-xMgxFe0.8)O3-ξ (x = 0.10, 0.15, 0.20) compounds showing individual contributions of Fe3+ and Fe4+ species
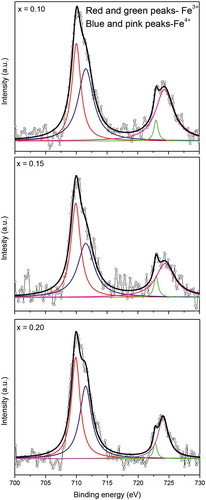
Table 2. XPS peak parameters of Fe 2p level in (Ba0.5Sr0.5)(Al0.2-xMgxFe0.8)O3-ξ (x = 0.05, 0.10, 0.15, 0.20)
Figure 6. XPS spectra of O1s for (Ba0.5Sr0.5)(Al0.2-xMgxFe0.8)O3-ξ (x = 0, 0.05, 0.10, 0.15, 0.20) with Gaussian fitting using two peaks in each case. The peaks with higher and lower binding energies are attributed to adsorbed oxygen species and surface oxide, respectively
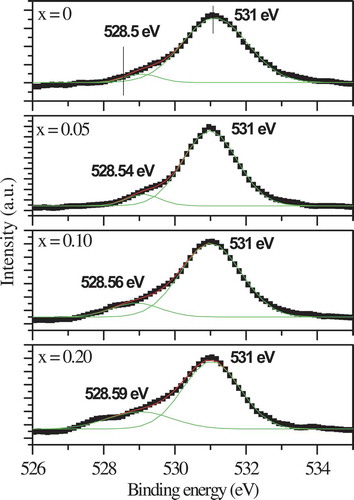
Table 3. XPS parameters of O1s in (Ba0.5Sr0.5)(Al0.2-xMgxFe0.8)O3-ξ (x = 0–0.20)
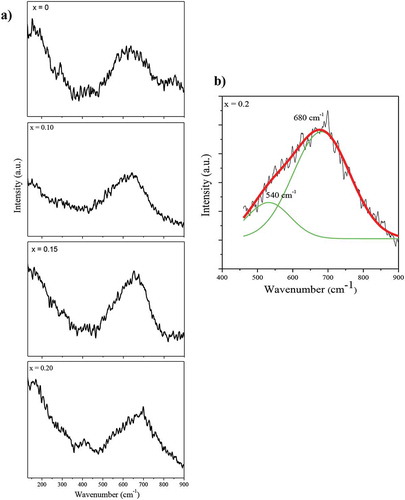
Figure 7. (a) Room temperature Raman spectra of (Ba0.5Sr0.5)(Al0.2-xMgxFe0.8)O3-ξ (x = 0, 0.10, 0.15, 0.20) in the wave number range of 110–900 cm−1 and (b) deconvoluted fitting curves covering span of 500–850 cm−1 (associated with oxygen vacancies) having peaks at 540 and 680 cm−1 for the composition x = 0.20