Figures & data
Table 1. Chemical composition (wt.%) of ceramic powder [Citation16]
Table 2. APS deposition parameters applied for the coating process
Table 3. Dry sliding wear test results of TiO2-45Cr2O3 coating
Table 4. Dry sliding wear test parameters
Table 5. Mechanical properties of counter body balls used in the wear tests [Citation17]
Figure 1. Worn track profilometer images used in calculating the wear rates. (a) 3D view (b) cross-section view (c) cross-section area (μm2)
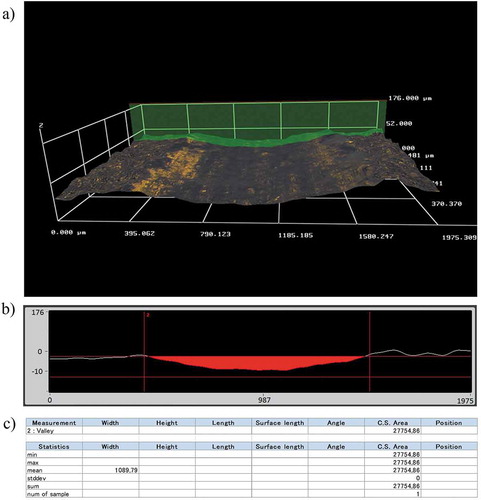
Figure 2. Cross-section SEM image of as-sprayed TiO2-45Cr2O3 coating
Figure 3. XRD patterns for TiO2-45Cr2O3 composition (a) powder (b) APS-sprayed coating
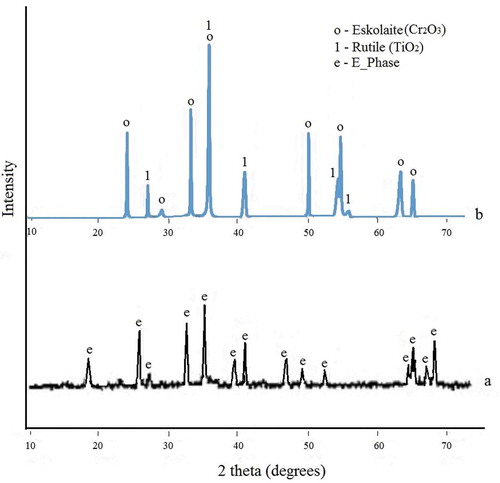
Figure 4. Worn surface SEM micrographs obtained using Al2O3 ball under different loads a1) 5 N b1) 10 N c1) 15 N (magnification 500x); 2) represents higher magnification (2kx) for corresponding images
Figure 5. Worn surface EDS images obtained using Al2O3 counter body ball. (load: 15 N; sliding frequency: 3 Hz) (a) area mapping (b) line scanning
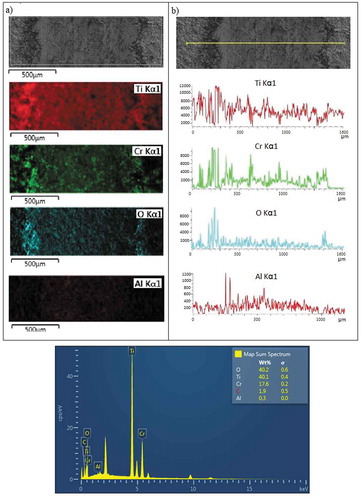
Figure 6. Worn surface SEM micrographs obtained using WC-Co ball under different loads (a) 5 N (b) 10 N c) 15 N (magnification: 500x); 1) represents higher magnification (2kx) for corresponding images
Figure 7. Worn surface EDS images obtained using WC-Co counter body ball. (load: 15N; sliding frequency: 3Hz) (a) area mapping (b) line scanning
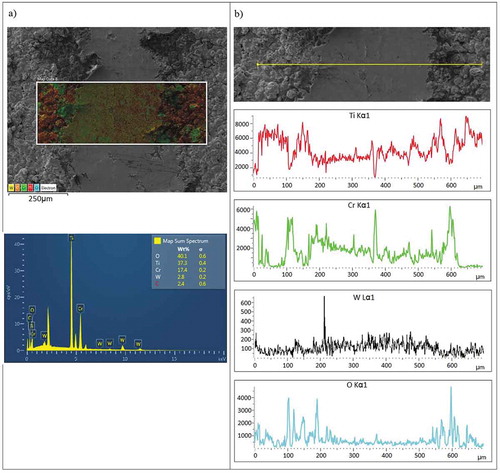
Figure 8. COF graphs of TiO2-45Cr2O3 coating under different loads and counter body balls
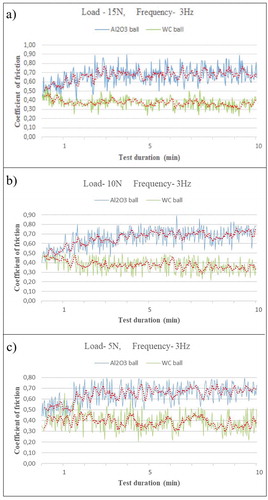
Figure 9. Schematic illustration of the change of wear mechanisms between the coating surface and the Al2O3 ball over the test time
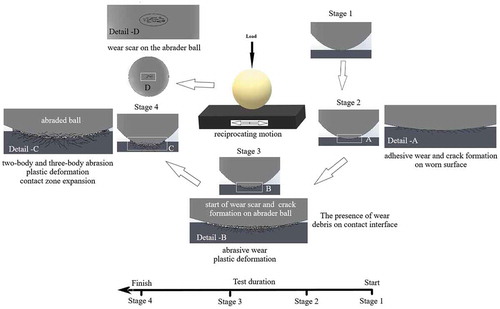
Figure 10. Optical profilometer images of worn surface counterparts under different loads (Frequency: 3 Hz) (a) 15 N, (b) 5 N, a1) and b1) represent top views of Al2O3 ball; a2) and b2) corresponding counterpart top views of the coating; a3) and b3) cross-section views of worn track
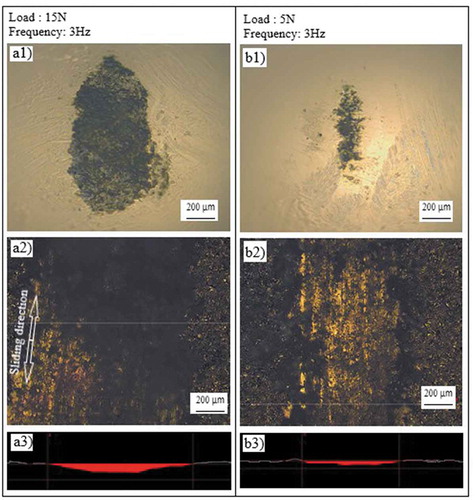
Figure 11. Worn surface images of TiO2-45Cr2O3 coating under different loads and counter body balls (a) Al2O3 ball (b) WC-Co ball
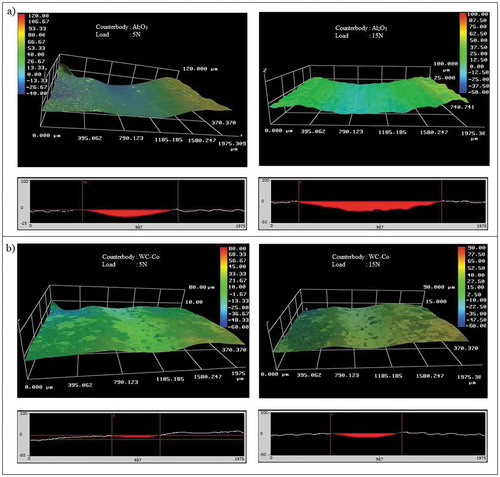
Figure 12. Mean values of the wear results of TiO2-45Cr2O3 coating under different loads and counter body balls (frequency: 3 Hz) (a) wear volume loss (b) specific wear rate
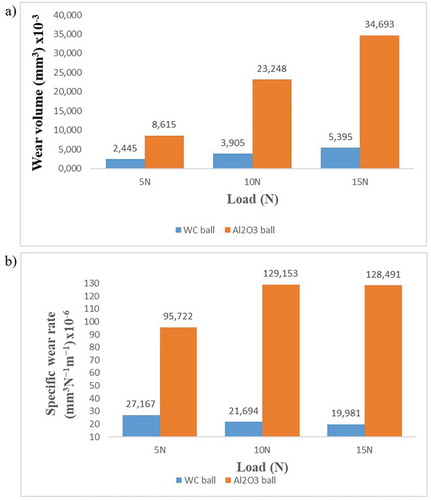
Figure 13. Worn surface morphologies taken after the wear tests carried out with Al2O3 ball at different sliding speeds and loads (magnification: 500x, f: reciprocating frequency)
Figure 14. Worn surface morphologies taken after the wear tests carried out with WC-Co ball at different sliding speeds and loads (magnification: 1000x, f: reciprocating frequency)
Figure 15. Mean COF value vs. sliding speed (reciprocating frequency) under different loads and counter body balls (a) WC-Co ball (b) Al2O3 ball
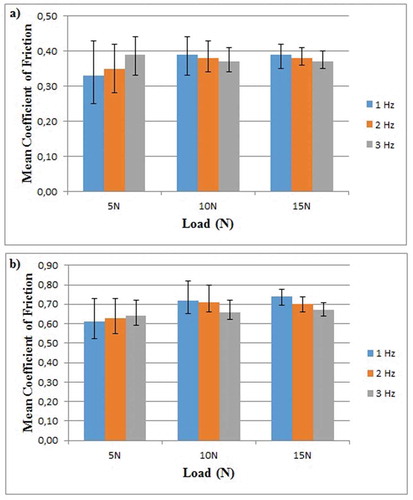
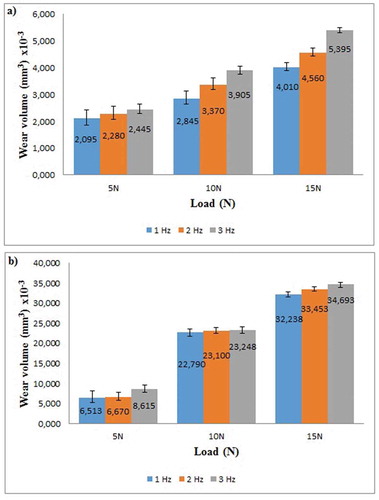
Figure 16. Variation of wear volume loss according to sliding speed and load with different counter body balls (a) WC-Co ball (b) Al2O3 ball